|
|
The B2yoR site contains are range of data and statistics about the 2yo season in general in the "2yo Racing 2002-5" section. Information in this form is not to everyone's taste and the majority of people just want to know what the implications are and the answers it produces when applied to individual races. Therefore, a lot of the statistics are kept in their own section so that those who like them can find them and those that do not, can sidestep them.
However, on occasions the noteworthiness of the messages that they contain mean that it is worth giving the statistics a wider distribution. The rest of this article tackles two important questions using data from the 2005 season :-
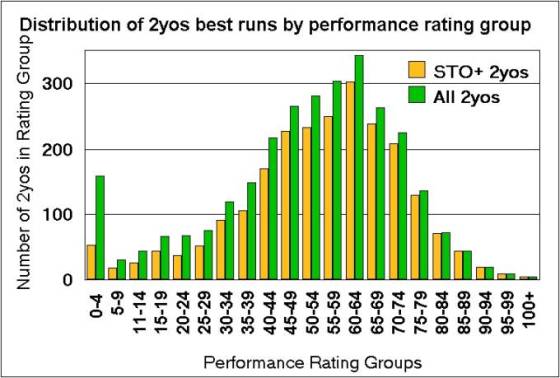
The chart below shows the distribution of the 2yos in 2005 by the best performance rating that they recorded using B2yoR figures. The rating groups are in 5 point bands - 50-54, 55-59, 60-64 etc. This split has partly been chosen because B2yoR uses a rating of 70 as a benchmark for a better quality 2yo. Therefore the split as 64-69, rather than 65-70, allows all of the 2yos that rated 70 or higher to be identified in the bar chart.
The chart shows two sets of data:-
It is worth noting the shape of the curve made by the bars and it how it differs from a 'Normal' distribution. Some background - in any measurement of a performance variable (including features such as height for instance) in a population the results are often very close to what is termed a 'Normal Distribution'. This ideal would show up as a perfectly symmetrical bell-shaped curve (stood on its broad end) with the average figure right in the middle of the curve at the highest point. This type of distribution produces the same results for the average, median and mode figure.
The curve in the chart above shows some evidence of this shape as would be expected. However rather than being symmetrical the shape has 'slumped' to the left with more horses at lower ratings and a longer tail-off on that side. The basic reason for this is that any physical, mental or training problem with a 2yo will lead to them showing less ability at the racecourse than they are capable of. This 'underperformance' shows up as the bias towards lower ratings.
The green bars which show the performances of all 2yos including those that only ran once and the chart shows a larger bias towards low figures and a notable peak of those rated 0-4 at best. The reasons for the 2yos that only ran once showing a slump towards lower ratings are fairly obvious. Most notably they have had less opportunity to show their actual best form. However, if they only ran once then they were probably not developed enough for 2yo racing or had a training setback.
This section addresses the issue of on which run the 2yos show their best rating, is it in the early outings or do the majority 'develop with racing'? The information covers the 2yos which ran at least twice during 2005, i.e. those who only made a debut outing are excluded.
The table below holds a range of interesting figures but for this section we can concentrate on the top two rows which are shaded in cream colouring. The numbers 1 to 14 at the top of the columns relate to the run number, i.e. 1 = first time out, the debut, 2 = second outing, 12 = twelfth racecourse run, etc. There was a total of 2337 horses that ran at least twice.
The first row in the table shows the number of the
2,337 2yos that achieved their best rating on that outing, for example
552 showed their peak form on debut and lesser ratings subsequently. The
second row turns the figure in the first row into a percentage of the total
of 2,337 horses that showed their best form on that run, the 552 that did
so on debut is 23.6% of the total.
| 1 | 2 | 3 | 4 | 5 | 6 | 7 | 8 | 9 | 10 | 11 | 12 | 13 | 14 | |
| Number of Best Rtgs | 552 | 833 | 523 | 192 | 93 | 63 | 34 | 20 | 9 | 10 | 6 | 1 | 0 | 1 |
| % of Best
Rtgs by 2yos |
23.6% | 35.6% | 23.3% | 8.6% | 4.2% | 2.8% | 1.5% | 0.9% | - | - | - | - | - | - |
| Total Runs | 2,337 | 2,337 | 1,834 | 1,199 | 801 | 562 | 359 | 218 | 148 | 95 | 62 | 30 | 15 | 9 |
| % of Best Runs
of Run Number |
23.6% | 35.6% | 28.5% | 16.0% | 11.6% | 11.2% | 9.5% | 9.2% | 6.1% | 10.5% | 9.7% | 3.3% | 0% | 11.1% |
| Strike Rate | 7.4% | 11.5% | 10.5% | 11.4% | 10.4% | 11.4% | 10.3% | 9.2% | 4.7% | 9.5% | 6.4% | 6.7% | 0% | 11.1% |
| % of Races won
on Run Number |
17% | 27% | 19% | 8% | 8% | 6% | 4% | 2% | 0.7% | 0.9% | - | - | - | - |
The other rows in the table present further information for those that are interested. The 'Total Runs' show the total number of runs of that outing number, the first two columns are 2,337 because of the stipulation that the data only covers those 2yos that ran at least twice. The approximately 600 individual that only made a debut are not included. The later figures in the row show how many horses ran that many times down to the 9 that made as many as 14 outings.
The fourth row then shows the percentage of the outings of that run number on which best form was shown. Therefore, it is the figure in the related first row divided by the figure in the third row. Remember, the percentage figures in the second row are out of the 2,337 total of 2yos.
The final two rows in the table give figures for two features which have some relation to the 'best rating' data. The 'Strike Rate' row shows the percentage of wins to total runs by 2yos on that particular outing. You may care to ponder why only 7.4% of 2yos win a race on their debut outing despite the fact that more than 23% of them are showing their best form of the season. Also, is there any real correlation underlying the apparently solid match between the 'Strike Rate' and '% of Best Runs of Run Number' from the fifth run onwards.
The final row gives the percentage of 2yo races (there were 998 in 2005) which were won by horses on that outing number. Although 2yos on debut have a low strike rate they still win as many as 17% of all races because all 2yos have to make a debut so they have more representatives in total in a season (roughly 23% of total 2yo runs).
Sections 2 & 3 have concentrated on presenting the background data to answer the questions posed in the first section. If you are one of those people with an intuitive 'feel' for equations and numbers you have perhaps been able to infer your own conclusions. If so, do not keep them to yourself - let us know. For the rest of us this section makes some points about the headline features of the information. In summary :-