BRITISH 2yo RACING
Trainer String Quality -
Data and Discussion
|
|
BRITISH 2yo RACING Trainer String Quality - Data and Discussion |
|
|
Article 14_001_2
7th January, 2014
|
This is mostly an informational article which looks at the relative quality of the 2yo strings that British trainers have had in recent years. The quality of the horses being measured by expressed performance on the track using B2yoR Estimates. Other measures, for example Prize Money earned, do not have the same direct link between results and ability of the individual,
While preparing the Quality data it seemed natural to extend the study, and the scope of this article, by adding the details of how much the Sales bought 2yos cost to acquire. This then leads into some of the examples and discussion about trainers' performance in the later sections of this article. Which do well with the quality of horses they have and which do not. Also related points such as how strongly oriented a stable is towards juvenile racing. Are the below average returns for some trainers due to a failing in some area or because they use the 2yo season to set horses up for their 3yo+ careers. Interesting points such as which trainers have declining resources and who has increasing buying power can also be identified.
With the addition of the Sales Price information it also became clear that some background would need to be added about that area to have chance of interpreting the results fairly. If there was a clean, linear, relationship between price paid at the Sales and likely performance rating range then further comment would not be needed. That link, if it exists as anything much beyond a small signal at the lowest price ranges, is much muddier and definitely non-linear.
The B2yoR Estimates have been reworked for the 2007 and 2010-13 seasons so those five years are used for the study. Only horses which have run at least two times in Britain as 2yos are included. For example, some trainers have long tails of 2yo debuts runs in late season who will not run again until they are 3yos. Many of those debuts will be 'Educational Intros' in some form and wil not allow a reasonable assessment of the horse's ability to be formed.
The following section provides a full example of all of the data lines produced by the study for trainer Kevin Ryan to explain the information fully. Mr Ryan produces solid, around average or above, results from his juvenile string while being well below the top rank in purchasing power. His £26,250 Sales Price median in 2013, i.e. for his 2yos of that year, ranking him 62nd out of 232 trainers. His buying level was still comfortably above the Median across all trainers in 2013 which was close to £10,500. The usual split with trainers showing up with the bulk of the purchasing power being concentrated in the top 20% or so of them with a long 'tail' of smaller strings. A key question is how well that Top 20% do in terms of real Performance ratings given their access to more, and higher priced, horses. Conversely, which trainers in the less well funded yards consistently produce average or better racecourse ratings results.
The table below shows the output for all data lines for trainer Kevin Ryan. The text following the table explains the information in each column of the table. Similar tables for the Top 58 trainers, by number of runners in 2013, are listed Alphabetically in the Appendix to this article.
| K. A. Ryan | ||||||||||||||||||
| YEAR | TYPE | MEAN RTG |
MEDN RTG |
TOT RTD |
SALE MEAN (£) |
SALE MEDN (£) |
BUY TOT |
< 1 | 1- 10 |
11- 20 |
21- 30 |
31- 40 |
41- 50 |
51- 60 |
61- 70 |
71- 80 |
81- 90 |
91- 100 |
| 1013 | ALL | 42.6 | 43.0 | 188 | 31,216 | 25,510 | 136 | 3 | 4 | 10 | 25 | 37 | 44 | 39 | 17 | 9 | 0 | 0 |
| 1013 | BUY | 45.4 | 46.0 | 136 | 31,216 | 25,510 | 136 | 1 | 2 | 3 | 18 | 27 | 31 | 30 | 15 | 9 | 0 | 0 |
| 2007 | ALL | 45.0 | 45.0 | 59 | 55,833 | 41,242 | 42 | 2 | 0 | 2 | 8 | 10 | 14 | 9 | 11 | 3 | 0 | 0 |
| 2010 | ALL | 41.8 | 43.0 | 41 | 25,194 | 23,100 | 31 | 1 | 2 | 2 | 3 | 10 | 8 | 11 | 2 | 2 | 0 | 0 |
| 2011 | ALL | 45.4 | 49.0 | 52 | 24,933 | 25,100 | 36 | 2 | 0 | 3 | 6 | 8 | 8 | 13 | 10 | 2 | 0 | 0 |
| 2012 | ALL | 40.4 | 41.0 | 52 | 40,271 | 25,935 | 36 | 0 | 2 | 1 | 11 | 10 | 15 | 9 | 2 | 2 | 0 | 0 |
| 2013 | ALL | 42.8 | 42.0 | 43 | 33,850 | 26,250 | 33 | 0 | 0 | 4 | 5 | 9 | 13 | 6 | 3 | 3 | 0 | 0 |
Table 1 - All Data Lines for Kevin Ryan
The 'Year' column identifies which Year, or set of Years, the Data Line relates to. The B2yoR ratings, the Estimates or [Est]s, have been reworked to the same baseline for 2007 & 2010-13 and there are individual lines for each of those five seasons. Where years are grouped together the last two digits of the first and last year of the set are used. Therefore '1013' indicates a summary of the four years 2010 to 2013. Note that the figures in these grouped lines are not averages of the average figures for each individual year. They work on the full set of underlying data to produce the summary data.
'Type' refers to what set of 2yos are included in the summary. Remember that as a starting point only 2yos that ran at least twice in Britain as juveniles are included. The type 'All' equates to this whole group of qualifying 2yos. Other Type codes are then used to denote sub-sets of this full group. 'Buy' refers to the sub-set of qualifying 2yos that were purchased at the Sales and the Total numbers later in the Data Line will indicate the size of the sub-set. This allows a check to be made on how reliant a trainer is on Sales Puchases compared to other sources such as Owner Bred horses, leases from Studs and so forth.
The next two columns labelled 'MEAN RTG' and 'MEDN RTG' refer to averages calculated on the same underlying data. The Mean Rating ('MEAN RTG') refers to the arithmetic mean of the Best B2yoR Estimate of all of the qualifying 2yos in that Data Line. The Median Rating ('MEDN RTG) is the Median figure for the same set of best Estimates. The Mean and Median figures are usually close to each other for these Ratings and 3-4 points difference a 'big' divergence. The bounded nature of equine performance figures assisting this. Horses are not going to run to a rating of 250, for example, and imbalance the averages calculated.
To give an indication of the ranges the 2013 Median Ratings figures for trainers ranged from 68.0 down to low negative values. However, the four Medians above 53.0 were all special cases and 53.0 would be a good rule-of-thumb figure to use as the upper end of the Medians achieved for a trainer running a full string of 2yos in Britain. Aidan O'Brien, for example, had a Median Rating of 64.0 in 2013 but only ran a selection of his very best 2yos in Britain and in our higher class, or very valuable, races. The Median of all the Trainers' Median Ratings in 2013 was 31.0 points. But, that reflects the long tail of smaller strings and larger and better funded stables, such as Kevin Ryan's, should be rating in the 40 to 53 range. The figures in Table 1. show that Mr Ryan is comfortably in that target area and is also at the lower end of Sales Median values for those larger stables.
The 'TOT RTD' column gives the Total Number of Qualifying 2yos in that Data Line. The larger the number then the bigger the Sample the Averages are based on. A larger sample being preferred because it is more likely to reflect a real 'Signal' rather than just natural variation that might occur with small strings of juveniles. Chris Mason as an example only had one qualifying horse in 2013 and had a 'Median' of 57.0. Clearly, you would stake nothing on him being able to repeat that Median Rating regularly. Whereas with Mr. Ryan you would have a pretty good idea what to expect in 2014, assuming nothing fundamental has changed in the equine resources he has available to him.
As a cross-check the 'TOT RTD' figure for the '1013' line should be the same as totalling the figures for each of the four individual years 2010 to 2013. The difference between the 'TOT RTD' in the 'All' and the 'Buy' figures for the '1013 summary lines shows how many of the trainer's 2yo passed through the Sales Ring. In Mr. Ryan's case this is 136 of 188 and around 72%. Compare this to Richard Hannon at 73%, Mark Johnston at 54% and Roger Charlton at 26%. It is interesting to think about the good and bad points about being too reliant on purchased or owner bred horses in light of those variations. Any differences between the Median Ratings for the Whole 2yo Group and those bought at sales might also indicate where a stable's strengths are. Whether that be Buying or Training, or Both, or Neither. A subject lightly considered in Section 5. below.
The two columns 'Sale Mean' and 'Sale Medn' relate to averages of the Sales Price of the 2yos bought at Auction who ran duing that year or period. To make the point clear the monetary figure average relates to puchases made for yearling the previous Autumn or 2yos at the early season 'Breeze-up Sales'. The two figures are the arithmetic Mean and the Median of the qualifying purchased juveniles. Note that the figures in the column are in Pounds Sterling (£GBP). Sales Prices in Euros (), US Dollars ($US) and the archaic Guineas (Gns, gn = £1.05) are converted to Sterling before the average calculations.
Note that the Mean and Median figures can show more variation between them than for the Race Performance ratings. The lowest price recorded in the study was £400 and the highest approching £800,000 which gives a scale much wider than the roughtly -10 to 90 for possible rating Estimates. Section 3.2 below considers the ranges of Sales Median figures but note that the Median across all 323 trainers in the 2010-13 period was just under £10,000 sterling.
The 'BUY TOT' column is the number of 2yos that were bought at the sales for the period the Data Line covers. Thus, in the lines coded 'Buy' this figure will be the same as the 'TOT RTD' number because all 2yos not purchased at Auctions are stripped out.
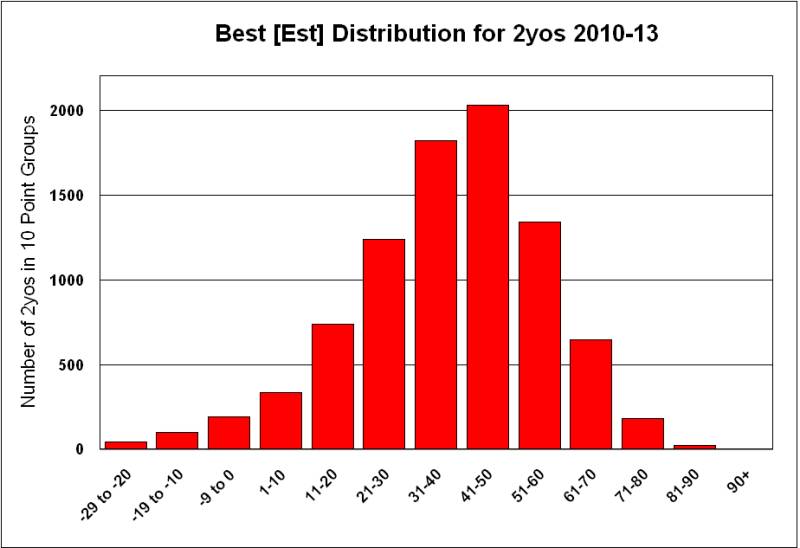
The final 11 Columns then show the Distribution of the qualifying 2yos across the set of Best Estimates Groups. The B2yoR scale allows negative Ratings and at the top end Ratings above 90 are rare (only Frankel and Dream Ahead in recent years). The positive Estimate ratings are grouped into 10 point blocks (1-10, 11-20, etc) and each qualifying 2yo is then assigned to a group by the Best Estimate it recorded as a juvenile. This section of Kevin Ryan's Data Table is repeated below to show how his horses are split up across the Best Estimate groups.
|
|
|||||||||||||||||||||||||||||||||||||||||||||||||||||||||||||||||||||||||||||||||||||||||||||||||||||||||||||||||||||
Figure 1 - 2yos Best [Est] Rating Distribution Data for Kevin Ryan and overall Distribution 2010-13
The colouration of the columns requires a brief explanation. The Darkest Green column is for the '41-50' Best Estimate range Group. This Group has the largest number of 2yos in it within the overall distribution of all 2yos (see the Bar graph alongside the Ryan table in Figure 1). The two lighter Green columns either side are the next most numerous in terms of members followed by the Darker Grey cells either side. The Bar Chart showing the Distribution of Best Estimates for all qualifying 2yos is next to the Ryan table and clicking on the Chart will link to the full size version.
The colouration in the table is aimed at showing how the figures given for the subject trainer relate to the overall distribution for Best Estimates. Mr Ryan is a good trainer producing solid performance results with his 2yos and his figures balance out either side of his '41-50' group maximum in a typical manner for his type of record. Trainers with above or below average results will show up where their figures are not balanced around the usual maximum group. Try looking at the Richard Hannon figures in the table in Section 5.5 to get a feel for what the top 2yo handler can achieve. A trainer who buys well at the sales and then extracts close to the last possible rating point out of every 2yo in his stable.
The following two sub-sections show 2010-13 summary Data lines for the Top 20 Trainers with the proviso that they must have had at least 5 qualifying 2yos run for them during that period. The first sub-section shows the Top 20 for the highest Median Ratings of their 2yo strings. The second gives the Top 20 when the Data Lines are sorted by the Sales Median figures of their 2yos that were bought at public Auctions. The Tables assist further in gaining an understanding of the range and 'shape' of high results and prices and therefore to be able to interpret the individual results a trainer achieves. In both cases the sub-section contain general notes about the results and their use. A good question to ponder is how much overlap is their between the two Top 20s? Further, is there any worthwhile correlation visible between Prices paid and Ratings produced?
3.1 Trainers by 2yo String Median Rating
The table below is ordered by the Median Rating of the qualifying 2yos for the period 2010-13. Note that the lines are of the 'All' type which means it includes the whole set of 2yos that ran for the trainer, wherever they were sourced from, i.e. Sales, Owner Breds, leases, and so on.
| TRAINER | YEAR | MEAN RTG |
MEDN RTG |
TOT RTD |
SALE MEAN (£) |
SALE MEDN (£) |
BUY TOT |
< 1 | 1- 10 |
11- 20 |
21- 30 |
31- 40 |
41- 50 |
51- 60 |
61- 70 |
71- 80 |
81- 90 |
91- 100 |
| A. P. O'Brien | 1013 | 70.8 | 64.0 | 18 | 414,799 | 378,000 | 6 | 0 | 0 | 0 | 0 | 0 | 0 | 3 | 6 | 6 | 3 | 0 |
| I. A. Wood | 1013 | 47.0 | 55.0 | 9 | 22,943 | 22,050 | 8 | 0 | 1 | 0 | 1 | 0 | 2 | 3 | 2 | 0 | 0 | 0 |
| S. B. Suroor | 1013 | 52.7 | 53.0 | 127 | 158,487 | 126,000 | 40 | 0 | 0 | 1 | 6 | 12 | 31 | 40 | 29 | 7 | 1 | 0 |
| M. A. Jarvis | 1013 | 49.4 | 52.5 | 16 | 121,409 | 97,125 | 10 | 0 | 0 | 2 | 0 | 2 | 3 | 5 | 3 | 1 | 0 | 0 |
| J. Noseda | 1013 | 50.1 | 51.0 | 62 | 99,657 | 70,264 | 44 | 0 | 0 | 2 | 5 | 8 | 14 | 18 | 11 | 2 | 2 | 0 |
| M. A. Zarooni | 1013 | 49.0 | 51.0 | 176 | 176,678 | 141,750 | 59 | 1 | 0 | 5 | 12 | 26 | 39 | 65 | 20 | 8 | 0 | 0 |
| B. W. Hills | 1013 | 50.3 | 50.0 | 74 | 58,974 | 49,150 | 48 | 0 | 1 | 3 | 3 | 7 | 24 | 16 | 15 | 5 | 0 | 0 |
| Ed Walker | 1013 | 42.6 | 50.0 | 19 | 53,594 | 42,000 | 16 | 1 | 0 | 2 | 0 | 3 | 4 | 6 | 2 | 1 | 0 | 0 |
| P. W. Chapple-Hyam | 1013 | 47.7 | 49.5 | 56 | 37,295 | 27,300 | 33 | 1 | 1 | 0 | 4 | 11 | 12 | 13 | 12 | 2 | 0 | 0 |
| H. R. A. Cecil | 1013 | 49.0 | 49.0 | 38 | 101,552 | 61,813 | 12 | 0 | 0 | 1 | 2 | 7 | 12 | 9 | 5 | 1 | 0 | 1 |
| R. Hannon | 1013 | 48.3 | 49.0 | 575 | 53,401 | 41,475 | 422 | 6 | 9 | 16 | 43 | 77 | 155 | 127 | 108 | 29 | 5 | 0 |
| D. H. Brown | 1013 | 44.5 | 48.0 | 45 | 48,535 | 30,000 | 29 | 2 | 0 | 0 | 8 | 6 | 11 | 8 | 8 | 1 | 1 | 0 |
| J. H. M. Gosden | 1013 | 47.9 | 48.0 | 144 | 125,220 | 89,250 | 57 | 0 | 0 | 4 | 7 | 27 | 45 | 35 | 21 | 5 | 0 | 0 |
| R. A. Mills | 1013 | 44.4 | 48.0 | 23 | 29,871 | 26,000 | 16 | 1 | 0 | 0 | 1 | 4 | 11 | 3 | 3 | 0 | 0 | 0 |
| A. M. Balding | 1013 | 44.8 | 47.0 | 119 | 48,945 | 38,325 | 78 | 2 | 4 | 3 | 8 | 20 | 34 | 31 | 13 | 4 | 0 | 0 |
| C. B. Hills | 1013 | 44.2 | 47.0 | 91 | 66,526 | 45,000 | 55 | 0 | 2 | 8 | 7 | 16 | 30 | 13 | 11 | 3 | 1 | 0 |
| L. M. Cumani | 1013 | 43.9 | 46.5 | 56 | 84,857 | 66,675 | 30 | 1 | 2 | 2 | 5 | 6 | 23 | 11 | 4 | 2 | 0 | 0 |
| M. Stoute | 1013 | 46.7 | 46.5 | 88 | 197,050 | 187,075 | 21 | 0 | 1 | 2 | 5 | 20 | 33 | 12 | 10 | 5 | 0 | 0 |
| G. A. Butler | 1013 | 44.7 | 46.0 | 19 | 36,563 | 29,762 | 11 | 0 | 0 | 1 | 2 | 2 | 9 | 4 | 0 | 1 | 0 | 0 |
| E. S. McMahon | 1013 | 45.1 | 45.5 | 54 | 20,544 | 19,500 | 37 | 0 | 0 | 4 | 6 | 10 | 15 | 8 | 8 | 2 | 1 | 0 |
Table 2 - All 2010-13 Data for Top 20 Trainers ordered by String Median [Est] Rating
A general comment on the names in the Table are that they testify to more change than would be expected. The Top Ranks of established trainers feeling as if it is settled over long periods. But, Michael Jarvis and Henry Cecil have died and Ian Wood, in second place on a small number of runners, no longer trains. Barry (BW) Hills has retired and passed on his stable to son Charlie, who is also on the list. Trainer Richard Hannon retired on December 31st 2013, and has passed his stable onto his son, another Richard. Added to those moves both Mahmood Zarooni (8 years) and Gerard Butler (5 years) began long bans from training in 2013 for their use of doping products and injections, with the activities of both being described as 'reckless'. Interesting times.
Leaving aside special cases such as Aidan O'Brien and Ian Wood the range of Median Ratings runs from 53 down to 46 which sets a good benchmark for what range the 'Best' returns will be in. Of the others above 50.0 then Maktoum family funding is the most notable link. Suroor & Zarooni training solely for Godolphin, or it's second division Marmoon Racing which some 2yos got demoted to. Michael Jarvis' 16 juveniles included 11 from the Maktoum family or their Emirates associates.
One point to note is that the Suroor and Zarooni returns are 'fixed' to some extent. The Maktoum family breed and buy thousands of horses each year and only a selection of better types of that total will be placed under the Godolphin banner. Even then, if once in training the 2yos do not show a certain level of ability they will never run in the Godolphin colours. Either being sold on or demoted to run in other Maktoum family ownership colours for different trainers, Sheikh Mohammed's sons strings for example. Which means the Godolphin returns are also a 'Special Case' because of the selectivity.
The obvious example to compare them with is Richard Hannon who sits high in the list with a 49.0 rating. But, there is no selectivity going on with Hannon other than in choosing what to buy at the sales. Once a 2yo is in training with him it will almost certainly run for him no matter what quality. If a 2yo only capable of winning a seller or having some educational runs to be ready to win a weak nursery or claimer on the all-weather during the winter then it still gets into the Hannon record. Nothing is hidden in the back of the 'Shop'.
It is good to see younger trainers whom a positive opinion has been formed of in their short careers high up in this listing. The anecdotal feeling that develops while watching racing day after day, but never checked while on the treadmill, being backed up by some data. Ed Walker has made a good impression in his three seasons with a licence and improved his overall returns, total wins and Strike Rate as examples, each year. James Tate is just out of the Top 20 on a Median of 45.0 but with a Median at 50.0 for the 31 sales bought 2yos he has run in his two seasons training. His overall return being dragged down by the Owner Breds he has to run.
Having your record dragged down by having to run owner breds, of all shapes and sizes, brings up another point to consider. Who are the 'Top' trainers who are missing from the list? To pick a few names out, Mark Johnston returns 42.5 in 57th place. As with the low Strike Rate he maintains, for a trainer of his standing, you suspect that being a second level trainer for the Maktoums and handling a lot of their lesser home breds limits his performance if bulking up the quantities. Brian Meehan? Down in 36th on a reasonable 45.0 but his record dragged down by a very poor 2013 which seems to have coincided with his personal problems. It will be interesting to see how fares in 2014. Richard Fahey is 44th on the list at 44.5 but based on low Sales Median and the results still good.
A final item to note from the table is posing the question over how well the Sales Median figures match with the Median Ratings. Are the Sales Median figures mostly from the Top level of those figures (see Table in next sub-section)? Is there any sign of a progressive lessening of the Sales figure from Top to Bottom of this list? On the plus side you could say that some of the very highest figures are at the Top. But, as noted before both O'Brien's and the Godolphin figues are selected runners only and therefore special cases. We could also say that a good number of the trainers with the highest Sales Median returns ae not in this Table at all.
On the positive side you could also say that all twenty on the list are comfortably above the overall Median Rating figure for all trainers of around £10,000. But, that feels like comparing the 'Premier League', and the better funded end of the Championship, with the lower league and non-League stables. There ought to be a wider spread and, as the table shows, even those in the Top 20 are well mixed in terms of Rating Results to funding level. The positive correlation between Median Rating and Sales Median is rather weak and a good number of trainers are getting returns above their funding level, and a good number failing to reach a solid level despite the backing. A good question in these cases is what is the split between Sales buying performance and Training ability, or the lack thereof.
3.2 Trainers by Sale Buys Median Price
The table below is ordered by the Sales Median Price of the 2yos bought at Auction for the period 2010-13. Note that the Data Lines are of the 'Buy' type which means it includes only those purchased 2yos and none from any other source.
| TRAINER | YEAR | MEAN RTG |
MEDN RTG |
TOT RTD |
SALE MEAN (£) |
SALE MEDN (£) |
BUY TOT |
< 1 | 1- 10 |
11- 20 |
21- 30 |
31- 40 |
41- 50 |
51- 60 |
61- 70 |
71- 80 |
81- 90 |
91- 100 |
| A. P. O'Brien | 1013 | 64.7 | 64.0 | 6 | 414,799 | 378,000 | 6 | 0 | 0 | 0 | 0 | 0 | 0 | 2 | 3 | 1 | 0 | 0 |
| M. Stoute | 1013 | 48.2 | 49.0 | 21 | 197,050 | 187,075 | 21 | 0 | 0 | 1 | 1 | 1 | 11 | 3 | 3 | 1 | 0 | 0 |
| C. Appleby | 1013 | 46.0 | 47.0 | 10 | 190,121 | 173,402 | 10 | 0 | 0 | 0 | 1 | 2 | 3 | 3 | 1 | 0 | 0 | 0 |
| M. A. Zarooni | 1013 | 51.4 | 53.0 | 59 | 176,678 | 141,750 | 59 | 0 | 0 | 0 | 3 | 8 | 12 | 26 | 7 | 3 | 0 | 0 |
| S. B. Suroor | 1013 | 56.1 | 59.0 | 40 | 158,487 | 126,000 | 40 | 0 | 0 | 0 | 1 | 3 | 7 | 13 | 14 | 2 | 0 | 0 |
| Roger Varian | 1013 | 50.9 | 49.5 | 26 | 119,322 | 105,000 | 26 | 0 | 0 | 0 | 0 | 10 | 3 | 6 | 4 | 3 | 0 | 0 |
| M. A. Jarvis | 1013 | 50.7 | 53.5 | 10 | 121,409 | 97,125 | 10 | 0 | 0 | 1 | 0 | 2 | 2 | 2 | 2 | 1 | 0 | 0 |
| J. H. M. Gosden | 1013 | 46.2 | 48.0 | 57 | 125,220 | 89,250 | 57 | 0 | 0 | 3 | 4 | 11 | 16 | 13 | 9 | 1 | 0 | 0 |
| J. Noseda | 1013 | 53.5 | 52.0 | 44 | 99,657 | 70,264 | 44 | 0 | 0 | 1 | 1 | 4 | 10 | 16 | 8 | 2 | 2 | 0 |
| D. R. Lanigan | 1013 | 40.7 | 39.0 | 16 | 97,902 | 67,685 | 16 | 1 | 0 | 0 | 1 | 7 | 4 | 2 | 0 | 0 | 1 | 0 |
| L. M. Cumani | 1013 | 47.2 | 49.5 | 30 | 84,857 | 66,675 | 30 | 0 | 2 | 1 | 0 | 2 | 13 | 8 | 3 | 1 | 0 | 0 |
| W. J. Haggas | 1013 | 45.5 | 45.5 | 68 | 74,791 | 63,000 | 68 | 0 | 2 | 1 | 8 | 10 | 25 | 11 | 7 | 4 | 0 | 0 |
| H. R. A. Cecil | 1013 | 48.8 | 48.5 | 12 | 101,552 | 61,813 | 12 | 0 | 0 | 0 | 1 | 2 | 4 | 2 | 3 | 0 | 0 | 0 |
| E. A. L. Dunlop | 1013 | 43.3 | 43.0 | 59 | 89,343 | 57,750 | 59 | 0 | 1 | 0 | 9 | 18 | 12 | 12 | 6 | 1 | 0 | 0 |
| B. W. Hills | 1013 | 53.1 | 53.5 | 48 | 58,974 | 49,150 | 48 | 0 | 1 | 1 | 2 | 2 | 14 | 11 | 13 | 4 | 0 | 0 |
| M. Prescott | 1013 | 38.0 | 37.5 | 26 | 62,865 | 49,135 | 26 | 1 | 1 | 4 | 5 | 4 | 3 | 3 | 3 | 2 | 0 | 0 |
| M. L. W. Bell | 1013 | 38.6 | 40.0 | 55 | 63,376 | 48,765 | 55 | 2 | 3 | 1 | 10 | 14 | 12 | 9 | 2 | 2 | 0 | 0 |
| B. J. Meehan | 1013 | 48.0 | 47.5 | 128 | 61,321 | 47,775 | 128 | 2 | 0 | 5 | 7 | 16 | 42 | 33 | 13 | 10 | 0 | 0 |
| A. J. Perrett | 1013 | 39.9 | 43.0 | 27 | 66,133 | 47,250 | 27 | 0 | 0 | 4 | 2 | 7 | 6 | 8 | 0 | 0 | 0 | 0 |
| C. B. Hills | 1013 | 45.5 | 46.0 | 55 | 66,526 | 45,000 | 55 | 0 | 0 | 4 | 4 | 13 | 17 | 6 | 8 | 2 | 1 | 0 |
Table 3 - Sales Bought 2yos Data 2010-13 for Top 20 Trainers ordered by Sales Price Median
The following Section 3. considers issues surrounding the non-linearity of sales prices so that will not be covered here. A basic point to note about the table is the range of Median Ratings which make the Top 20 and there are clearly at least two separate levels there. At the Top are mostly the usual set of Coolmore (O'Brien) and Maktoum family backed trainers. The first stable on the list with no Coolmore, Maktoum or Dubai link would probably be that of the deceased Henry Cecil. Jeremy Noseda only has the ocasional runner for one of the Coolmore 'boys' and, along with Michael Stoute, has a good range of well funded patrons outside of the usual duo. As with the comment in the previous sub-section a large change is in progress with the high spending Qatari ruling family looking to join the top table and still in the process of building their trainer roster.
Whatever the changes, there is some sort of switchover around a Median of £90,000 and those below John Gosden. Those above and around the £60,000 level but below the top strata are either a small set in their own right or the Top of the main pack which starts just under £50,000 and form a complete spectrum for the other 300+ trainers which goes right down to the £1,000 level. A good question to ponder is how much better the 2yo Performance Median Ratings are, given the notably higher spending?
If you wanted to believe spending a lot of money was the answer to getting the 'best' 2yos then you could at least say that most of the Top 20 funded produce Median Ratings solidly into the 40s. Which would be a 'solid' if unremarkable return. You could easily produce another list of 20 trainers, leaving aside the O'Brien special case, who could equal or beat the Median Rating results and on lower Funding. Hannon, Fahey, Walker, P. Chapple-Hyam and so on.
You could also look at the Median Ratings achieved for Michael Bell, Mark Prescott, David Lanigan along with perhaps Ed Dunlop and Amanda Harwood/Perrett and consider whether they are getting the best out of the 2yos they have. Are they hampered by the resources they acquire from the sales or does the training need tweaking? Prescott is probably a special case and his record is covered further in sub-section 5.3 below. Lanigan appears, using the anecdotal antenna, to have mostly given up on having 2yo winners (a single win in 2013) and only runs the odd natural 2yo (Bold Lass in 2013) plus some expensive surplus stock which has already been identified as having low level ability.
A final point to check in the table is how the Best Estimates produced by these trainers' 2yos are distributed across the quality groups on the right side of the line. Remember that a solid result from a trainer like Keven Ryan, at a £25,500 Sales median, can produce 2yos distributed evenly either side central Dark Green column. An argument you will hear will be that the premium prices paid for young thoroughbreds is a 'gamble' over trying to find the one star, even a superstar, amongst a lot of ordinary, or worse, ones. Commonly referred to as a 'game' only very rich people can get involved in. How does the distributions for these trainers look? Any of them 'crushing it' in the manner of a top operater like Hannon? If they are not then what are the premium prices for? Can we all have a go at the game of spending other people's money in the name of 'expertise'? We all like a bit of responsibility with no accountability attached.
The idea for this article grew out of happenstance. B2yoR was putting some basic figures together of the Median Ratings for Trainers' 2yos as a cross-check and input to ongoing Race Profiling tests. The 'Sunday Forum' programme on Attheraces was on in the background, with it being, mercifully, McCririck free. The panel had been wittering on in the usual unfocussed manner about how effortlessly brilliant everyone was and had been gushing over the career of Richard Hannon with him days away from an official retirement from training. Plenty to gush about in the Hannon case, and with some hard evidence to back it up.
They then turned to the point that he had achieved all he had without serious funding and with 'cheap' horses until recently. Which is simply not true, although Hannon has punched well above his spending 'weight' for a long period, using some obvious ploys to enable that. This then developed, unfocussedly, to suggest how good it would be to have a single figure for each trainer along the "..cost per winner.." lines. How this would back up their waffle on the show. Alistair Down , one half of the panel, took this as a cue to proudly announce he had failed his Maths 'O' Level six times. Which presumably explains why he likes to position his output as mainly being 'Colour Pieces', written in bad prose. Just keep off the hard analysis stuff, Down.
Thinking about what a meaningful 'Cost Per Winner' type stat for a trainer might look like then got a bit out of hand. Which is why this article is too long. But, the use of Sales Median Prices compared to the Median Ratings for a 2yo String and across a reasonable time period do provide a useful background to at least attempt to rank trainers. Also to assist the thinking in what factors individual trainers are doing 'right' or 'wrong' to help or hinder their performance results.
At core the 'Cost per Winner' idea is fundamentally flawed as a simple, single, figure. It tacitly assumes, for example, that there is a simple and Linear relationship between how much you pay for a horse at the sales and how good a racehorse you can expect it to be. This then puts way too much of the 'difference' between trainers' results down to their ability to train horses. The relationship between sales prices and the type of horse you could expect to be buying is neither simple nor linear. Above a certain level the prices are a fantasy with premiums paid for unproven credentials the horses hold. Delve deeply into that premium area and you could convince yourself the outcomes in performance terms were uncorrelated to price paid. The following text considers a few difficulties with the simple 'Cost per Winner' ideal.
| YEAR | CATOLOGUED | OFFERRED | SOLD | AGGREGATE (Gns.) |
AVERAGE (Gns.) |
MEDIAN (Gns.) |
| 2013 | 965 | 878 | 765 | 35,359,000 | 42,529 | 37,000 |
| 2012 | 1,043 | 937 | 788 | 31,039,000 | 39,390 | 32,000 |
| 2011 | 833 | 750 | 635 | 25,284,500 | 39,818 | 30,000 |
| 2010 | 1,031 | 929 | 685 | 22,241,900 | 32,470 | 25,000 |
| 2009 | 820 | 733 | 606 | 20,565,500 | 33,936 | 25,000 |
| 2008 | 847 | 719 | 509 | 19,672,700 | 38,650 | 29,000 |
| 2007 | 633 | 569 | 473 | 23,907,500 | 50,544 | 35,000 |
| 2006 | 619 | 553 | 463 | 20,308,000 | 43,862 | 34,000 |
| 2005 | 869 | 771 | 636 | 16,988,400 | 26,711 | 18,000 |
| 2004 | 1,302 | 1,179 | 850 | 12,993,100 | 15,286 | 10,000 |
Table 4 - Yearling Sales Results for Tattersalls October Book 2 Sales
The table above shows the sales details for the Tattersalls October Book 2 auction (TO2) from 2004 to 2013. Tattersalls are the largest sale house in Europe and their set of October Sales (Books 1-3) offer the largest number of yearlings. The Book 1 is seen as the Premier Sale and will usually produce the highest yearling sale prices paid in Europe each year. It is worth reiterating that Tattersalls will apply a selection procedure to accept yearlings into their sales, often including physical inspection. The TO2 sale is then the big 'middle-ground' sale with a wide range of types and pedigrees. The highest prices paid will approach those at the top of the TO1 sale but will range down to real cheap buys, or retainees.
It is an interesting table in it's own right to see how the figures have moved over the period. Despite the financial climate and 'Global Meltdowns' and the like, this is a business where less horses were sold in 2013 for around £34 Million in sterling than in 2004 for an aggregate (the total of all horses sold) of near £12.5 Million. Which seems to indicate that owning racehores is not a 'business' for an awful lot of people. There is no economic reason why a similar set of horses should be worth so much more in 2013. Where has the extra value of those horses come from? Like owning Football Clubs in Britain, sound financial models and Business plans are in short supply. The balloon stays in the air as long as wealthy people are willing to burn money underneath it for no hope of a worthwhile monetary return.
For the purposes of this article the last column is most interesting which shows the Sales Median for the TO2 sales. It was nearly 50% higher in 2013 than it had been in 2010 and clearly that makes it difficult to start comparing years directly. There needs to be a Baseline to try to account for the variability in the Strength of the Sales Markets. Remember that the TO2 sales are the biggest source of 2yos available to most trainers in one package. In 2013 a total of 401 of the 2yos to race in Britain had been sold at the TO2 sales in 2012. This equated to around 15% of the total and they ran for 103 different trainers.
255 of the 2013 British raced juveniles were sold at the Doncaster Auctions' main sale (the Premier Yearlings) as a comparison and the Doncaster sales are specifically targeted at 2yo pedigrees and type. There were 396 yearlings sold at that sale in 2012 for a Median of £20,000. Which raises another complicating factor of how you compare 2yos bought at different sales. The more fashionable sales and those marketed as being 'Premier' in some manner will attract a wider set of buyers and the 'strength' of the Market different from sale to sale. Added to that you have the issue of how to compare foreign buys with the regular set of US purchases added to in recent years by an increasing number of French sale purchases. With French bred horses qualifying for a premium, on top of the higher prize money, in French races which makes it worth British traners' while to make trip over to France with the French sale purchases. They will be able to win more money for placing in a claimer than they would for winning a British maiden race.
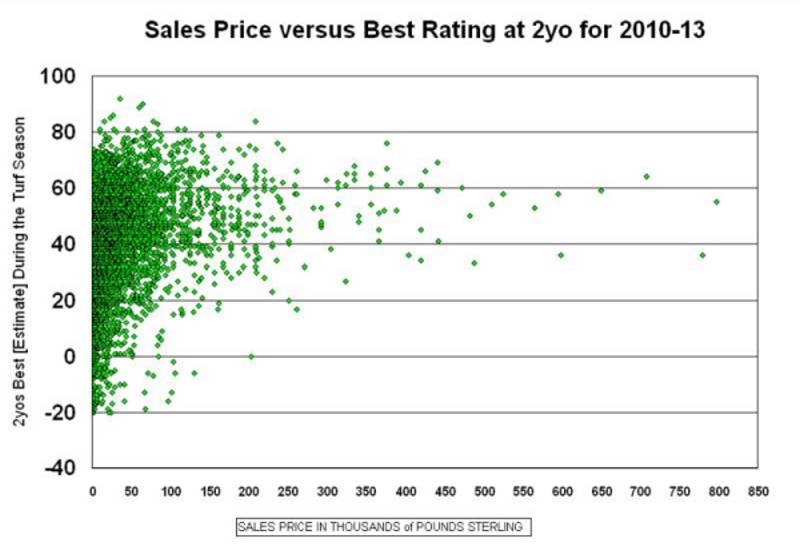
While the variability between different sales and for the same sale across different years are troublesome there is one much more important factor. That is that there in no simple relationship between sales price and expected performance on the track. Figure 2 above shows the results of plotting the Sales Price against the Best Rating at 2yo for over 5,000 juveniles from the 2010-13 seasons. If, for example, there were a simple Linear relation between the two factors then the dots would make a pattern from bottom left up towards the top right and you could fit a straight line neatly to the pattern.
There isn't that neat pattern here. On visual inspection the most you might suggest is that there is a very steep bottom left to top right line from the £400 juveniles but which has curved over to reach a straight line well before the £50,000 level. If you were looking to give some definite advice based on the plot you couldn't get much beyond the following suggestions :-
The non-linearity is obvious with a little thought. If you spend £50,000 and get an OR75 rated maiden winner and handicapper you will have had a good result. If you spend £500,000 on a yearling there is no way for it to be a ten times better racehorse. The obvious question being - are the factors that push horses into these premium levels worth the prices paid? There seems a simple answer.
This shape of prices means that it is hard to compare a Godolphin purchase with one bought in the sub £80,000 region. Godolphin, and the others at that level, are taking a gamble on one of these high priced buys being an exceptional runner and go on to be a sire and pay for the numerous 'flops'. That is assuming they care about it in commercial terms at all. Coolmore compete at these levels but really do understand the gamble they are taking. It was how John Magnier, Robert Sangster and Vincent O'Brien (unrelated to Aidan) built the business in the first place. Purchasing high priced yearlings at US sales to be trained in Ireland and race in Europe, when that was a novelty. Then getting enough good ones to be profitable sires, from Nijinsky forwards, to pay for the expensively acquired flops.
A closing point would be to think about where Richard Hannon junior is going in 2014 now he is in charge of the stable. If you look at Figure 2 the yard's success has been built on being able to find more of the dots bubbling along the top of the patch in the £10,000 to £80,000 range at the sales than others do. Now they can buy more at the £100,000 range and above, will that make any difference to the record? There are a lot less dots out there and they are not any higher than in the range they have already been purchasing in.
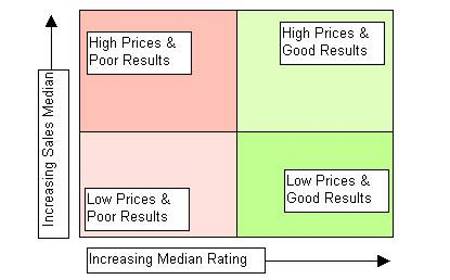
The Figure below is a simple representation of the four Trainer Types that are used. By plotting increasing Sales Median against increasing Performance Median Rating we can split Trainers' record into four basic types. The following four sub-sections suggests real examples of those types. It is then possible to ponder on what that tells us about a trainer's overall ability. A nerdy item of interest would be to note that at the centre point of the diagram where the lines cross there is a point where a trainer is 'Average' at both measures. Averagely well funded and achieving average results. The closest fit to that point is Anne Duffield.
The naming of the sub-sections 5.3, 5.4 & 5.5 represent a deliberate usage of the 'British Racing Defence'. The core of this approach is the 'Negating a Positive' gambit in an attempt to disguise a possible, even if only mild, questioning of a trainer (or jockey or horse, etc) over their ability and results. Regular followers of British Racing will recognise that all interviews, articles, and so forth appear to need to be based on the inquisatory level of "How do you manage to be so effortlessly brilliant, all of the time?". Which leads to the peculiar position where everybody involved seems to be marvellous & 'above average', which is quite remarkable.
[It also leads to a variety of nonsense being accepted as worthwhile comment. "That wasn't the greatest maiden ever run..", for example, which would cover 99.9 recurring percent of races run. Well done for that incisive insight, Mr Einstein. Or the tortuously twisted "not over-big", which if parsed and unpacked seems to mean 'Big'. But is used to refer to horses on the smaller side of medium or below. Just tell us how tall it is in Hands, or in metres preferably, and stop this obfuscation. But that never seems to occur to anyone.]
If the previous sections have done a good job of describing the Data Tables and how to interpret the information in them then the examples in these sub-sections should speak for themselves. But worth picking out a few trainers to reiterate the points. First two trainers who fit into the top right hand, light green, cell of the figure.
| J. H. M. Gosden | ||||||||||||||||||
| YEAR | TYPE | MEAN RTG |
MEDN RTG |
TOT RTD |
SALE MEAN (£) |
SALE MEDN (£) |
BUY TOT |
< 1 | 1- 10 |
11- 20 |
21- 30 |
31- 40 |
41- 50 |
51- 60 |
61- 70 |
71- 80 |
81- 90 |
91- 100 |
| 1013 | ALL | 47.9 | 48.0 | 144 | 125,220 | 89,250 | 57 | 0 | 0 | 4 | 7 | 27 | 45 | 35 | 21 | 5 | 0 | 0 |
| 1013 | BUY | 46.2 | 48.0 | 57 | 125,220 | 89,250 | 57 | 0 | 0 | 3 | 4 | 11 | 16 | 13 | 9 | 1 | 0 | 0 |
| J. Noseda | ||||||||||||||||||
| YEAR | TYPE | MEAN RTG |
MEDN RTG |
TOT RTD |
SALE MEAN (£) |
SALE MEDN (£) |
BUY TOT |
< 1 | 1- 10 |
11- 20 |
21- 30 |
31- 40 |
41- 50 |
51- 60 |
61- 70 |
71- 80 |
81- 90 |
91- 100 |
| 1013 | ALL | 50.1 | 51.0 | 62 | 99,657 | 70,264 | 44 | 0 | 0 | 2 | 5 | 8 | 14 | 18 | 11 | 2 | 2 | 0 |
| 1013 | BUY | 53.5 | 52.0 | 44 | 99,657 | 70,264 | 44 | 0 | 0 | 1 | 1 | 4 | 10 | 16 | 8 | 2 | 2 | 0 |
Tables 5 & 6 - John Gosden & Jeremy Noseda, High Sales Median but High Performance with it
Two trainers who are in the top bracket for resources but turn out above average results from that backing. Looking at the anecdotal summary B2yoR carries around about all trainers as a 'Rough Guide' this matches well. Both are trainers who you would be happy to back one of their 2yos and expect it to run to form and find normal improvement. Noseda can seem to be too much of a perfectionist, or worrier, at times and some 2yos can present as overdone but overall a reliable handler. One point to note would be whether the small number of runners in 2013 for Noseda was due to a drop in funding and owners or because of some health issue with the juveniles.
Looking at the Best Estimate distributions both seem to be doing a solid job in sourcing higher class horses and getting them to rate highly through the training regime. Gosden has a record of 17 wins from 94 runs in Class 1 races at an 18% Strike Rate and seems to judge ability well. The Market usually knows they are good as well though and a solid loss backing them all despite the win percentage. The majority of the 13 individual Class 1 winners have been Owner Breds.
Noseda has a 14-91 record in Class 1 events since 2005 and, despite a higher SP set overall, still a solid loss on them.
In many ways this is the most interesting sector because it involves searching through the long tail of small stables to find trainers who regularly produce at least average results from low funding level. Unlike Noseda and Gosden in the previous sub-section you have a good chance of finding value Prices in the Betting Market for 2yos trained by the good trainers in this bracket. The Market, and the various agents that form it, will tend to be using a similar Bluffers' Guide sheet to assess trainers and the likes of Noseda and Gosden will often be overbet just on reputation. The overvaluing assisted by the number of noughts on the end of their sales' bought 2yos along with the pedigrees and owners' names.
Conversely, many smaller stables will be undervalued, to a large extent on nothing more than Market formers knowing little about them and not putting any time into finding anything out. The 'British Racing Defence' summary of them will be the word 'unfashionable'. The further North you train from assists your unfashionability and being female does as well. If you have read this document fully and had a look through the data tables you will know more about many trainers than the average Market person.
| P. J. McBride | ||||||||||||||||||
| YEAR | TYPE | MEAN RTG |
MEDN RTG |
TOT RTD |
SALE MEAN (£) |
SALE MEDN (£) |
BUY TOT |
< 1 | 1- 10 |
11- 20 |
21- 30 |
31- 40 |
41- 50 |
51- 60 |
61- 70 |
71- 80 |
81- 90 |
91- 100 |
| 1013 | ALL | 39.6 | 40.0 | 16 | 6,701 | 3,150 | 11 | 0 | 0 | 0 | 4 | 4 | 6 | 2 | 0 | 0 | 0 | 0 |
| 1013 | BUY | 41.9 | 45.0 | 11 | 6,701 | 3,150 | 11 | 0 | 0 | 0 | 2 | 1 | 6 | 2 | 0 | 0 | 0 | 0 |
| L. Stubbs | ||||||||||||||||||
| YEAR | TYPE | MEAN RTG |
MEDN RTG |
TOT RTD |
SALE MEAN (£) |
SALE MEDN (£) |
BUY TOT |
< 1 | 1- 10 |
11- 20 |
21- 30 |
31- 40 |
41- 50 |
51- 60 |
61- 70 |
71- 80 |
81- 90 |
91- 100 |
| 1013 | ALL | 41.4 | 41.0 | 17 | 7,845 | 8,000 | 13 | 0 | 0 | 1 | 3 | 4 | 6 | 2 | 1 | 0 | 0 | 0 |
| 1013 | BUY | 43.9 | 48.0 | 13 | 7,845 | 8,000 | 13 | 0 | 0 | 1 | 1 | 2 | 6 | 2 | 1 | 0 | 0 | 0 |
Tables 7 & 8 - P. McBride & Linda Stubbs, Low Sales Median but Good Median [Est] Ratings
Mr McBride's returns were a surprise to B2yoR and he seems to be doing a very good job but that fact had escaped notice. Two responses to seeing his data. The first to wonder why if his initials are "P. J." why does everyone call him 'Charlie', don't they? The second was to go and look at his detailed information on the website to see what is going on.
Conversely, long-time readers of the website will know that B2yoR holds the Stubbs' family set-up in well above average regard. Their MO being to buy a small set of yearlings each year and give them full 2yo seasons. The target being to get 1 or 2 rated highly enough (say OR90+), to be sold on at a profit to race in Hong Kong and help to keep the whole show going. You would expect that the pressure of having to make this plan work instills the sort of introspection required to judge personal performance correctly and improve where needed. Unlike some people with high priced youngstock being delivered to their stable yard doors each year.
Two Listed level winners in recent years with horses that cost 14,500 guineasand 2,500 guineas to add to the generally very good returns. Linda's daughter Kristin took over the stable licence in 2013 having been the assistant for many years. A poor return in 2013 in the sense of a single win and the Sales Median went up to £12,600. But, the Median Rating of the sales buys was still good at 42.0 so hopefully 2013 was a minor blip rather than indicating something significant had changed.
Not an area of the plot that anyone would want to be in because there is not a possible excuse available, as there might be with trainers working with cheaper horses. But, any trainer even mildly targetting 2yo racing should be able to get a Median Rating return comfortably into the 40s. If that is not being achieved then something is not quite right. To muddy the waters a bit, and help with the pretence of not wanting to suggest anyone is less than effortlessly brilliant, the fault could lie in two main places.
The first is with recruitment of horses. A trainer provided with less able athletes, whatever they cost to buy or breed, cannot be expected to turn them into average or better class runners. If a trainer is not responsible for many of the purchases in their yard, and the buys are then topped up by an assortment of owner breds of variable quality, then the results may well be poor. Even if the trainer is competent in their training work role. If they buy themselves then they clearly have to accept that failing.
The second main area is in the training, preparation and placing of the horses which must be the trainer's responsibility. Having spent a lot of years studying 2yo racing, and paying the bills backing juveniles, a ranking of trainers becomes a necessity. The preposterous "everyone's marvellous.." approach is not an option. Preparing and looking at the data of trainer's regular performance becomes natural as well to confirm, or occasionally refute, the anecdotal opinions. Looking at thousands of 2yos in Paddock Review, what types they are, how they are presented, and so on assists in giving clues as to what might underlie the below average returns.
Section 3.2 suggested a few names who are not doing well enough and three more candidates summary tables follow. The first is an interesting case and the low Median Rating may well be by design rather than some incompetence.
| M. Prescott | ||||||||||||||||||
| YEAR | TYPE | MEAN RTG |
MEDN RTG |
TOT RTD |
SALE MEAN (£) |
SALE MEDN (£) |
BUY TOT |
< 1 | 1- 10 |
11- 20 |
21- 30 |
31- 40 |
41- 50 |
51- 60 |
61- 70 |
71- 80 |
81- 90 |
91- 100 |
| 1013 | ALL | 36.0 | 37.0 | 76 | 62,865 | 49,135 | 26 | 3 | 4 | 11 | 13 | 13 | 12 | 8 | 9 | 2 | 1 | 0 |
| 1013 | BUY | 38.0 | 37.5 | 26 | 62,865 | 49,135 | 26 | 1 | 1 | 4 | 5 | 4 | 3 | 3 | 3 | 2 | 0 | 0 |
Table 9 - Mark Prescott, High Sales Median but Below Average Median [Est] Ratings
Mark Prescott would qualify as a good trainer so why does he get below average returns? The obvious answer is that he deliberately splits his 2yo string into two parts. Those who can compete as '2yo types' wil be in his first batch of runners and most will normally win at some point and he does well in getting multiple wins. Mr. Prescott regularly goes on about how he is 'sent' a lot of slow developing horses with 10 furlong, or further, pedigrees. He batches many of these up and gives them three quick runs over inadequate distances at 2yo, with the horses often looking totally clueless about what being a racehorse entails. The whole point is to hold down their expressed rating as juveniles. Next we turn to a couple of more puzzling trainers.
| J. R. Fanshawe | ||||||||||||||||||
| YEAR | TYPE | MEAN RTG |
MEDN RTG |
TOT RTD |
SALE MEAN (£) |
SALE MEDN (£) |
BUY TOT |
< 1 | 1- 10 |
11- 20 |
21- 30 |
31- 40 |
41- 50 |
51- 60 |
61- 70 |
71- 80 |
81- 90 |
91- 100 |
| 1013 | ALL | 34.6 | 32.0 | 17 | 56,753 | 44,625 | 10 | 0 | 1 | 2 | 5 | 4 | 2 | 2 | 1 | 0 | 0 | 0 |
| 1013 | BUY | 35.0 | 33.0 | 10 | 56,753 | 44,625 | 10 | 0 | 0 | 2 | 3 | 2 | 1 | 2 | 0 | 0 | 0 | 0 |
| E. F. Vaughan | ||||||||||||||||||
| YEAR | TYPE | MEAN RTG |
MEDN RTG |
TOT RTD |
SALE MEAN (£) |
SALE MEDN (£) |
BUY TOT |
< 1 | 1- 10 |
11- 20 |
21- 30 |
31- 40 |
41- 50 |
51- 60 |
61- 70 |
71- 80 |
81- 90 |
91- 100 |
| 1013 | ALL | 35.3 | 38.0 | 22 | 47,875 | 28,350 | 17 | 2 | 0 | 2 | 3 | 5 | 6 | 2 | 2 | 0 | 0 | 0 |
| 1013 | BUY | 34.6 | 37.0 | 17 | 47,875 | 28,350 | 17 | 2 | 0 | 1 | 2 | 5 | 4 | 2 | 1 | 0 | 0 | 0 |
Tables 10 & 11 - J. Fanshawe & E. Vaughan, High Sales Median but Below Average Median [Est] Ratings
What is going wrong with the Fanshawe performance? Go back to 2007 and he ran 17 qualifying horses with seven bought at auction for a Median of nearly £64,000. He returned a Median Rating of 47.0. Which is fine. But 2010-13 and the runners total is well down and the Strike Rates are much lower. He still has a few expensive horses but not of better quality and only 1-2 wins per year and none in the worst seasons? Clearly some problems.
Some of the same themes with Ed Vaughan. He made a reasonable impression for 3-4 seasons from his first year in 2004. Working with small strings of 2yos. But the Median Rating has always been low and had reached dismal levels in 2012 until a better 2013. But a complete blank with no 2yo win between October 2010 until the 3 individual winners in 2013. A suspect profile.
Three examples in this section plus a question over another trainer. As hinted at before these trainers working with lower priced 2yos might invoke that as a reason for the poor returns. But, it a relatively easy to find examples of trainers with similar 'opportunities' who produce good results over an extended period of study. Some of that might just be luck but the longer it goes on the less that seems to be the primary difference.
| D. Shaw | ||||||||||||||||||
| YEAR | TYPE | MEAN RTG |
MEDN RTG |
TOT RTD |
SALE MEAN (£) |
SALE MEDN (£) |
BUY TOT |
< 1 | 1- 10 |
11- 20 |
21- 30 |
31- 40 |
41- 50 |
51- 60 |
61- 70 |
71- 80 |
81- 90 |
91- 100 |
| 1013 | ALL | 20.2 | 20.0 | 27 | 19,697 | 15,750 | 19 | 4 | 4 | 6 | 7 | 2 | 3 | 0 | 1 | 0 | 0 | 0 |
| 1013 | BUY | 22.1 | 21.0 | 19 | 19,697 | 15,750 | 19 | 2 | 3 | 4 | 5 | 2 | 2 | 0 | 1 | 0 | 0 | 0 |
Table 12 - D. Shaw, Lower Sales Median but Not Good Median [Est] Ratings
Derek Shaw had long been a trainer to avoid with his 2yos, in B2yoR's view. In the period of 2004-11 he managed a single win from 52 separate 2yo runners (i.e. 1 win from 275 runs by 52 different horses). A sentence which seems to need little supporting evidence. No matter how limited many of those 2yos were in ability you could name tens of trainers who you would expect to produce a better result. The real clincher though has been the performance Shaw has achieved with a group of more expensive 2yos for the owner B. Johnson. These are a purchases targetted at 2yo racing yet there overall performance has been dire. Most of the horses looking clueless and under-prepared to add to the plain lack of wins and worthwhile ratings.
| N. Tinkler | ||||||||||||||||||
| YEAR | TYPE | MEAN RTG |
MEDN RTG |
TOT RTD |
SALE MEAN (£) |
SALE MEDN (£) |
BUY TOT |
< 1 | 1- 10 |
11- 20 |
21- 30 |
31- 40 |
41- 50 |
51- 60 |
61- 70 |
71- 80 |
81- 90 |
91- 100 |
| 1013 | ALL | 24.0 | 24.5 | 42 | 15,243 | 8,000 | 32 | 5 | 3 | 10 | 8 | 9 | 5 | 2 | 0 | 0 | 0 | 0 |
| 1013 | BUY | 25.4 | 28.5 | 32 | 15,243 | 8,000 | 32 | 4 | 2 | 7 | 5 | 8 | 4 | 2 | 0 | 0 | 0 | 0 |
Tables 13 - N. Tinkler, Lower Sales Median but Not Good Median [Est] Ratings
Nigel Tinkler is another regular in the category of a trainer whose 2yos are to be avoided. You could be told he had the second coming of Frankel in his stable running in a juvenile maiden and you would watch the race and certainly not bet on it. The working summary of his horses being that he bought small and square ones at whatever price range, got them above averagely fit for debut and got a number of long SP places. But that 'promise' was very rarely fulfilled and winners also rare. Both the buying and the training being under question. Looking at his overall record then 2011 must have been a fluke unless he really did do something different that season. If he did he should do it again.
| A. J. McCabe | ||||||||||||||||||
| YEAR | TYPE | MEAN RTG |
MEDN RTG |
TOT RTD |
SALE MEAN (£) |
SALE MEDN (£) |
BUY TOT |
< 1 | 1- 10 |
11- 20 |
21- 30 |
31- 40 |
41- 50 |
51- 60 |
61- 70 |
71- 80 |
81- 90 |
91- 100 |
| 1013 | ALL | 27.7 | 31.0 | 63 | 20,134 | 7,327 | 40 | 8 | 6 | 8 | 7 | 16 | 12 | 4 | 1 | 1 | 0 | 0 |
| 1013 | BUY | 34.8 | 37.5 | 40 | 20,134 | 7,327 | 40 | 2 | 3 | 3 | 4 | 12 | 11 | 4 | 0 | 1 | 0 | 0 |
Tables 14 - A. McCabe, Lower Sales Median but Not Good Median [Est] Ratings
Alan McCabe is a trainer that puzzles B2yoR somewhat, having been well enough disposed to his 2yos in his early days when he got acceptable returns in 2006-08. But it has been downhill since then and it took some expensive backing from the Wentworths to get his one reasonable year in 2011. That owner has now moved on to use other trainers, although both parties seem to insist this break was entirely amicable.
But, for a Paddock Reviewer, the McCabe horses pose a couple of issues. One of which is that he and his bloodstock agent like to buy smaller ones and even when given a lot of money to spend still get smaller, but bulky, ones. Look at his higher priced purchases as a set and some problems seem to be common. The second issue is that his horses do not seem to run as well as they look and also do not run to a consistent level. He, and his staff, are terrific at turning the horses out looking well, smart and so on. He has a lot of cheap ones that look as if they ought to be usable at a low level and certainly given how well turned out they are. But that rarely translates into performance. Adding that background to the overall returns in 2009-13 make a trainer whose 2yos are to be avoided but without a strong grasp of why the various pieces are not coming together better.
And finally, Does David Evans belong in this Quarter on the record shown in the table? Are we looking at a Brute Force approach to getting some usable 2yos or is there a bit more skill involved?
| P. D. Evans | ||||||||||||||||||
| YEAR | TYPE | MEAN RTG |
MEDN RTG |
TOT RTD |
SALE MEAN (£) |
SALE MEDN (£) |
BUY TOT |
< 1 | 1- 10 |
11- 20 |
21- 30 |
31- 40 |
41- 50 |
51- 60 |
61- 70 |
71- 80 |
81- 90 |
91- 100 |
| 1013 | ALL | 32.3 | 33.0 | 114 | 11,535 | 9,354 | 77 | 6 | 5 | 15 | 23 | 23 | 20 | 17 | 5 | 0 | 0 | 0 |
| 1013 | BUY | 37.2 | 36.0 | 77 | 11,535 | 9,354 | 77 | 1 | 3 | 7 | 14 | 20 | 13 | 14 | 5 | 0 | 0 | 0 |
Table 15 - David Evans, Low Sales Median, What Rating Median level?
This sub-section uses the Sales Median returns for the four years 2010-13 to identify two pairs of trainers. The first of those are trainers where the figure has gone up during that period and two trainers with rising profiles. The first is a chance to wedge the full Richard Hannon data into the article.
| R. Hannon | ||||||||||||||||||
| YEAR | TYPE | MEAN RTG |
MEDN RTG |
TOT RTD |
SALE MEAN (£) |
SALE MEDN (£) |
BUY TOT |
< 1 | 1- 10 |
11- 20 |
21- 30 |
31- 40 |
41- 50 |
51- 60 |
61- 70 |
71- 80 |
81- 90 |
91- 100 |
| 1013 | ALL | 48.3 | 49.0 | 575 | 53,401 | 41,475 | 422 | 6 | 9 | 16 | 43 | 77 | 155 | 127 | 108 | 29 | 5 | 0 |
| 1013 | BUY | 50.6 | 51.0 | 422 | 53,401 | 41,475 | 422 | 2 | 6 | 6 | 27 | 50 | 110 | 98 | 92 | 26 | 5 | 0 |
| 2007 | ALL | 48.0 | 49.5 | 100 | 42,931 | 36,750 | 79 | 1 | 2 | 5 | 4 | 18 | 22 | 28 | 12 | 8 | 0 | 0 |
| 2010 | ALL | 48.7 | 49.0 | 130 | 44,743 | 32,000 | 94 | 1 | 2 | 2 | 12 | 17 | 38 | 23 | 27 | 7 | 1 | 0 |
| 2011 | ALL | 50.7 | 51.0 | 147 | 44,995 | 38,000 | 113 | 2 | 2 | 2 | 9 | 16 | 39 | 29 | 30 | 16 | 2 | 0 |
| 2012 | ALL | 48.6 | 50.0 | 144 | 63,164 | 44,609 | 100 | 2 | 3 | 2 | 7 | 21 | 38 | 40 | 26 | 3 | 2 | 0 |
| 2013 | ALL | 45.4 | 45.5 | 154 | 60,248 | 46,769 | 115 | 1 | 2 | 10 | 15 | 23 | 40 | 35 | 25 | 3 | 0 | 0 |
Table 16 - Richard Hannon and Sales Median Increase
The increase in the 2yo string of the Hannon stable since 2008 has been remarkable, jumping from around 100 juvenile runners before that and reaching a new record with 174 individual 2yo runners in 2013. Equally remarkable has been that the stable's performance returns have increased from a high base to be terrific. Strike Rate, debut Strike Rate and Number of wins have all gone up solidly. To highlight the success of the sales buying the percentage of winning 2yos to maidens by turf season end is now consistently over 50%. Getting above 40% is a good effort.
The stable has seen an influx of new owners during the 2008-13 period including in recent years the Arab owners that Hannon had often said he lacked. He also often said he would like to see what he could do with unusually wealhy owners backing him and we have found out. Hamdan Al Maktoum, Saeed Manana and the Qatari al Thani family have joined the owners along with other wealthy backers. 2014 would have seen the Godolphin blue colours on a Hannon runner but for the unfortunate death of Piping Rock from colic in late December of his successful 2yo season.
Looking at the table above the Sales Median has gone up steadily and you would expect it to go up again in 2014 given the level of funding and the increased strength of the yearling market in 2013. But the Median Rating has not gone up to the same degree and you might suggest that somewhere around 50 is an upper limit. The number of horses in the top distribution groups has also not changed notably despite the increased number of £100,000 purchases. Again, the Hannons are good at the sales buying but the increased funding level is pushing them into the premium price levels where the number of higher class horses available in weakly correlated (if at all) with the increasing price level.
| M. Botti | ||||||||||||||||||
| YEAR | TYPE | MEAN RTG |
MEDN RTG |
TOT RTD |
SALE MEAN (£) |
SALE MEDN (£) |
BUY TOT |
< 1 | 1- 10 |
11- 20 |
21- 30 |
31- 40 |
41- 50 |
51- 60 |
61- 70 |
71- 80 |
81- 90 |
91- 100 |
| 1013 | ALL | 42.3 | 42.0 | 77 | 51,891 | 31,500 | 49 | 1 | 1 | 3 | 5 | 22 | 26 | 11 | 7 | 0 | 1 | 0 |
| 1013 | BUY | 47.2 | 47.0 | 49 | 51,891 | 31,500 | 49 | 0 | 0 | 0 | 3 | 11 | 17 | 10 | 7 | 0 | 1 | 0 |
| 2007 | ALL | 35.8 | 35.5 | 8 | 30,348 | 31,500 | 7 | 0 | 0 | 1 | 2 | 3 | 1 | 0 | 1 | 0 | 0 | 0 |
| 2010 | ALL | 44.3 | 46.5 | 12 | 17,641 | 19,450 | 8 | 0 | 1 | 0 | 0 | 3 | 5 | 0 | 3 | 0 | 0 | 0 |
| 2011 | ALL | 47.0 | 48.0 | 13 | 30,181 | 18,000 | 9 | 0 | 0 | 0 | 0 | 3 | 6 | 3 | 1 | 0 | 0 | 0 |
| 2012 | ALL | 43.3 | 42.0 | 25 | 52,224 | 42,517 | 17 | 0 | 0 | 1 | 2 | 8 | 7 | 4 | 2 | 0 | 1 | 0 |
| 2013 | ALL | 38.2 | 40.0 | 27 | 82,808 | 42,000 | 15 | 1 | 0 | 2 | 3 | 8 | 8 | 4 | 1 | 0 | 0 | 0 |
Table 17 - Marco Botti and Sales Median Increase
A simpler story with Marco Botti and one of a younger trainer who seems to have reached some sort of 'Tipping Point' in reputation. Mr Botti could have stayed in Italy and continued on with the family record of being perpetual Champion Trainer there. Instead he decided to take the risk of training in Britain where we may have low prize money levels but it does actually get paid out. After making a good impression with small strings early on there was a lull but the last two seasons have seen a real change with increased funding, new building going on to extend his yard and so on. Mind you, still needs to work on that Median Rating figue.
To complete the story a pair of trainers who are in a decline that needs halting.
| M. P. Tregoning | ||||||||||||||||||
| YEAR | TYPE | MEAN RTG |
MEDN RTG |
TOT RTD |
SALE MEAN (£) |
SALE MEDN (£) |
BUY TOT |
< 1 | 1- 10 |
11- 20 |
21- 30 |
31- 40 |
41- 50 |
51- 60 |
61- 70 |
71- 80 |
81- 90 |
91- 100 |
| 1013 | ALL | 40.2 | 41.5 | 36 | 57,226 | 31,500 | 23 | 1 | 0 | 2 | 4 | 10 | 10 | 7 | 2 | 0 | 0 | 0 |
| 1013 | BUY | 39.7 | 42.0 | 23 | 57,226 | 31,500 | 23 | 1 | 0 | 1 | 3 | 5 | 7 | 5 | 1 | 0 | 0 | 0 |
| 2007 | ALL | 44.4 | 44.5 | 18 | 117,340 | 99,750 | 9 | 0 | 0 | 0 | 3 | 4 | 5 | 3 | 3 | 0 | 0 | 0 |
| 2010 | ALL | 40.8 | 41.0 | 8 | 98,730 | 42,000 | 6 | 0 | 0 | 1 | 1 | 2 | 2 | 1 | 1 | 0 | 0 | 0 |
| 2011 | ALL | 50.4 | 47.0 | 7 | 70,100 | 52,500 | 5 | 0 | 0 | 0 | 0 | 1 | 3 | 2 | 1 | 0 | 0 | 0 |
| 2012 | ALL | 36.0 | 37.0 | 13 | 29,330 | 19,558 | 7 | 1 | 0 | 0 | 3 | 4 | 1 | 4 | 0 | 0 | 0 | 0 |
| 2013 | ALL | 37.4 | 40.5 | 8 | 33,601 | 16,800 | 5 | 0 | 0 | 1 | 0 | 3 | 4 | 0 | 0 | 0 | 0 | 0 |
Table 18 - Marcus Tregoning and Sales Median Decrease
Up until 2005 Tregoning had a well above average record with 2yos and would be on the list of solid trainers to take seriously. It has been a slow decline since then and the 2010-13 period have seen a real slump with less runners, winners and below average Strike Rates. The Sales Median tells a lot of that story and comparing the 2007 figures to those in 2012-13 make grisly reading. There is presumably still a solid trainer in there but the equine recruitment department needs major overhaul.
| J. W. Hills | ||||||||||||||||||
| YEAR | TYPE | MEAN RTG |
MEDN RTG |
TOT RTD |
SALE MEAN (£) |
SALE MEDN (£) |
BUY TOT |
< 1 | 1- 10 |
11- 20 |
21- 30 |
31- 40 |
41- 50 |
51- 60 |
61- 70 |
71- 80 |
81- 90 |
91- 100 |
| 1013 | ALL | 35.5 | 33.0 | 51 | 21,359 | 15,000 | 37 | 0 | 3 | 6 | 13 | 10 | 11 | 4 | 3 | 1 | 0 | 0 |
| 1013 | BUY | 37.1 | 36.0 | 37 | 21,359 | 15,000 | 37 | 0 | 2 | 3 | 9 | 7 | 10 | 2 | 3 | 1 | 0 | 0 |
| 2007 | ALL | 38.7 | 39.0 | 15 | 31,708 | 29,019 | 10 | 0 | 1 | 0 | 1 | 7 | 4 | 2 | 0 | 0 | 0 | 0 |
| 2010 | ALL | 35.8 | 32.5 | 10 | 28,678 | 22,503 | 8 | 0 | 0 | 3 | 1 | 2 | 2 | 0 | 2 | 0 | 0 | 0 |
| 2011 | ALL | 37.2 | 34.5 | 22 | 16,419 | 10,417 | 18 | 0 | 2 | 1 | 7 | 3 | 4 | 3 | 1 | 1 | 0 | 0 |
| 2012 | ALL | 32.5 | 33.0 | 11 | 33,833 | 32,000 | 7 | 0 | 0 | 2 | 3 | 3 | 3 | 0 | 0 | 0 | 0 | 0 |
| 2013 | ALL | 34.9 | 33.0 | 8 | 7,120 | 4,989 | 4 | 0 | 1 | 0 | 2 | 2 | 2 | 1 | 0 | 0 | 0 | 0 |
Table 19 - John Hills and Sales Median Decrease
John Hills' figures seem to tell a lot of the story just on reading. He moved stables in 2013 and had a new hook-up to be a trainer for Hamdan Al Maktoum but the performance results do not match with that upbeat summary. Looking at the Median Rating figures he achieves and they were always poor for a stable of his size and they seem to have settled into a basement level. Unlike Tregoning the 2yos from the stable were always ones to be wary of in B2yoR's betting view. You could not rely on them to run to a consistent level and Mr. Hills to extract the best from them. Perhaps he is more 3yo season oriented but with the focus on this website it is the juveniles that matter.
As a reference and for general interest the table below shows the results for the same period for a set of major Owner Breeders (OBs). There are no Sales Median & Mean figures in the table because the 2yos never went through the sales ring. The OBs have spent huge sums of money to get to the position where they can produce these number of 2yos to race. Buying and running their Studs, building up a broodmare band, using fashionable stallions, the list is endless. The Maktoum family have probably spent a figure in excess of £10 Billion in this activity over the years.
| OWNER BREEDER | YEAR | MEAN RTG |
MEDN RTG |
TOT RTD |
< 1 | 1- 10 |
11- 20 |
21- 30 |
31- 40 |
41- 50 |
51- 60 |
61- 70 |
71- 80 |
81- 90 |
91- 100 |
| Hamdan Bin Mohammed | 1013 | 50.3 | 55.0 | 35 | 0 | 0 | 1 | 3 | 5 | 6 | 12 | 4 | 3 | 1 | 0 |
| Godolphin | 1013 | 50.1 | 52.0 | 174 | 0 | 0 | 4 | 12 | 22 | 43 | 55 | 27 | 10 | 1 | 0 |
| Ahmed Al Maktoum | 1013 | 48.8 | 49.5 | 14 | 0 | 0 | 1 | 0 | 1 | 7 | 2 | 2 | 1 | 0 | 0 |
| K Abdulla | 1013 | 48.5 | 49.0 | 80 | 0 | 1 | 1 | 5 | 10 | 28 | 22 | 7 | 5 | 0 | 1 |
| L Rothschild | 1013 | 46.4 | 46.5 | 20 | 0 | 0 | 0 | 2 | 6 | 5 | 3 | 4 | 0 | 0 | 0 |
| Hamdan Al Maktoum | 1013 | 45.7 | 46.0 | 118 | 1 | 1 | 2 | 11 | 26 | 33 | 29 | 12 | 3 | 0 | 0 |
| Ballymacoll Stud | 1013 | 42.2 | 46.0 | 13 | 0 | 1 | 0 | 2 | 2 | 4 | 3 | 1 | 0 | 0 | 0 |
| The Queen | 1013 | 43.2 | 44.0 | 25 | 0 | 0 | 2 | 4 | 5 | 5 | 4 | 4 | 1 | 0 | 0 |
| JC Smith | 1013 | 43.2 | 43.5 | 26 | 0 | 0 | 1 | 5 | 5 | 8 | 4 | 2 | 1 | 0 | 0 |
| Cheveley Park Stud | 1013 | 44.5 | 42.0 | 37 | 0 | 0 | 1 | 6 | 7 | 13 | 4 | 5 | 0 | 1 | 0 |
| K Rausing | 1013 | 34.1 | 36.5 | 24 | 1 | 1 | 3 | 4 | 5 | 4 | 3 | 3 | 0 | 0 | 0 |
Table 20 - Selected Large Owner Breeder Homebreds sorted by Median [Est] Rating
The table is ordered by decreasing 2yo Median Rating and a few points to note. The striking one is that all this investment has produced results in the usual range for a well funded trainer buying at the sales. Other than the Maktoum related special cases, and Khalid Abdulla, the distribution of Best Estimates around the '41-50' dark green column is unexceptional. If they are producing better class juveniles it is at close to a typical rate and surrounded by others of a typical range of racing ability.
The 55.0 Median Rating for the 2yos nominally bred by Sheikh Mohammed's son Hamdan is also a bit puzzling. It is on the high side and presumably there is some selectivity, as with Godolphin, around which 2yos run in that name. All of those horses run for Mark Johnston and as noted above his Median Rating tends to be low and the number of Maktoum family owner breds perhaps holding his returns down. Looking at this table you would wonder how much lower they would be without the owner breds. Johnston still has a possible counter to that in that he prefers to buy slower developing horses with 10 furlong and further pedigrees.
The one wholly commerical Stud on the list - Cheveley Park - seem to be turning out results at odds with their reputation. But their position probably reflects their commercial status. They are not turning out huge numbers of yearlings and then keeping the best for themselves. They will sell off most of males they breed and then race the females to identify those they want to keep for their breeding operation. A different model to the others who are producing a high number of horses in an attempt to improve their chances of having Group 1 level runners.
The final table is for general interest. The top two lines show the performance of the 2yos bought at Auction for Godolphin and Hamdan Al Maktoum. The interest is in comparing how this sector compares to the homebreds in the previous table.
| OWNER | YEAR | MEAN RTG |
MEDN RTG |
TOT RTD |
SALE MEAN (£) |
SALE MEDN (£) |
BUY TOT |
< 1 | 1- 10 |
11- 20 |
21- 30 |
31- 40 |
41- 50 |
51- 60 |
61- 70 |
71- 80 |
81- 90 |
91- 100 |
| Godolphin | 1013 | 49.4 | 53.0 | 153 | 164,988 | 136,500 | 153 | 1 | 0 | 5 | 9 | 23 | 31 | 55 | 24 | 5 | 0 | 0 |
| Hamdan Al Maktoum | 1013 | 52.0 | 52.0 | 82 | 151,175 | 126,000 | 82 | 0 | 1 | 1 | 4 | 5 | 26 | 19 | 23 | 3 | 0 | 0 |
| Highclere TB | 1013 | 44.5 | 43.5 | 38 | 90,617 | 85,567 | 38 | 1 | 1 | 1 | 1 | 8 | 12 | 11 | 0 | 3 | 0 | 0 |
| Middleham Park Rcg | 1013 | 44.5 | 45.0 | 69 | 21,948 | 17,000 | 69 | 1 | 1 | 2 | 7 | 12 | 25 | 11 | 7 | 3 | 0 | 0 |
Table 21 - Maktoum Family Owner Breeders' Sales Buys compared to Major Syndicate Owners' Purchases
Added to the table, again for comparison, are the results for two of the major Syndicate owner groups in Britain. Over the last 2-3 years Middleham Park Racing had bubbled into the B2yoR conciousness, during the daily work, as a team that were doing something positively different in terms of horse recruitment, as with the Hannon & Doyle partnership. The Median Ratings and Best Estimates they have achieved over the last four season, on a lowish Sales Median, would seem to back up that anecdotal assessment.
APPENDIX :- Data Tables for the Top 58 Trainers in 2013 by Number of Runners
| C. Appleby | ||||||||||||||||||
| YEAR | TYPE | MEAN RTG |
MEDN RTG |
TOT RTD |
SALE MEAN (£) |
SALE MEDN (£) |
BUY TOT |
< 1 | 1- 10 |
11- 20 |
21- 30 |
31- 40 |
41- 50 |
51- 60 |
61- 70 |
71- 80 |
81- 90 |
91- 100 |
| 1013 | ALL | 39.6 | 40.0 | 29 | 190,121 | 173,402 | 10 | 0 | 0 | 3 | 4 | 9 | 6 | 5 | 2 | 0 | 0 | 0 |
| 1013 | BUY | 46.0 | 47.0 | 10 | 190,121 | 173,402 | 10 | 0 | 0 | 0 | 1 | 2 | 3 | 3 | 1 | 0 | 0 | 0 |
| 2013 | ALL | 39.6 | 40.0 | 29 | 190,121 | 173,402 | 10 | 0 | 0 | 3 | 4 | 9 | 6 | 5 | 2 | 0 | 0 | 0 |
| G. Baker | ||||||||||||||||||
| YEAR | TYPE | MEAN RTG |
MEDN RTG |
TOT RTD |
SALE MEAN (£) |
SALE MEDN (£) |
BUY TOT |
< 1 | 1- 10 |
11- 20 |
21- 30 |
31- 40 |
41- 50 |
51- 60 |
61- 70 |
71- 80 |
81- 90 |
91- 100 |
| 1013 | ALL | 37.9 | 37.5 | 54 | 30,209 | 26,250 | 39 | 1 | 2 | 4 | 9 | 16 | 10 | 9 | 3 | 0 | 0 | 0 |
| 1013 | BUY | 39.0 | 38.0 | 39 | 30,209 | 26,250 | 39 | 1 | 1 | 3 | 6 | 11 | 6 | 8 | 3 | 0 | 0 | 0 |
| 2010 | ALL | 25.8 | 26.0 | 6 | 14,070 | 12,940 | 4 | 1 | 1 | 1 | 0 | 2 | 0 | 0 | 1 | 0 | 0 | 0 |
| 2011 | ALL | 46.5 | 53.0 | 15 | 38,057 | 29,762 | 11 | 0 | 0 | 0 | 3 | 3 | 1 | 6 | 2 | 0 | 0 | 0 |
| 2012 | ALL | 37.7 | 39.5 | 18 | 30,885 | 31,500 | 12 | 0 | 1 | 2 | 1 | 6 | 6 | 2 | 0 | 0 | 0 | 0 |
| 2013 | ALL | 34.5 | 34.0 | 15 | 27,719 | 26,650 | 12 | 0 | 0 | 1 | 5 | 5 | 3 | 1 | 0 | 0 | 0 | 0 |
| A. M. Balding | ||||||||||||||||||
| YEAR | TYPE | MEAN RTG |
MEDN RTG |
TOT RTD |
SALE MEAN (£) |
SALE MEDN (£) |
BUY TOT |
< 1 | 1- 10 |
11- 20 |
21- 30 |
31- 40 |
41- 50 |
51- 60 |
61- 70 |
71- 80 |
81- 90 |
91- 100 |
| 1013 | ALL | 44.8 | 47.0 | 119 | 48,945 | 38,325 | 78 | 2 | 4 | 3 | 8 | 20 | 34 | 31 | 13 | 4 | 0 | 0 |
| 1013 | BUY | 47.3 | 48.0 | 78 | 48,945 | 38,325 | 78 | 1 | 2 | 1 | 2 | 11 | 27 | 21 | 10 | 3 | 0 | 0 |
| 2007 | ALL | 48.1 | 44.0 | 19 | 32,464 | 30,975 | 12 | 0 | 0 | 0 | 1 | 5 | 7 | 3 | 0 | 3 | 0 | 0 |
| 2010 | ALL | 48.2 | 48.0 | 21 | 22,512 | 21,000 | 13 | 0 | 0 | 0 | 2 | 4 | 6 | 5 | 2 | 2 | 0 | 0 |
| 2011 | ALL | 50.4 | 51.0 | 37 | 42,166 | 31,500 | 25 | 0 | 1 | 1 | 1 | 4 | 10 | 10 | 8 | 2 | 0 | 0 |
| 2012 | ALL | 42.5 | 44.0 | 33 | 55,822 | 34,375 | 22 | 1 | 0 | 1 | 3 | 6 | 12 | 8 | 2 | 0 | 0 | 0 |
| 2013 | ALL | 37.6 | 41.5 | 28 | 69,045 | 51,250 | 18 | 1 | 3 | 1 | 2 | 6 | 6 | 8 | 1 | 0 | 0 | 0 |
| T. D. Barron | ||||||||||||||||||
| YEAR | TYPE | MEAN RTG |
MEDN RTG |
TOT RTD |
SALE MEAN (£) |
SALE MEDN (£) |
BUY TOT |
< 1 | 1- 10 |
11- 20 |
21- 30 |
31- 40 |
41- 50 |
51- 60 |
61- 70 |
71- 80 |
81- 90 |
91- 100 |
| 1013 | ALL | 41.2 | 41.0 | 57 | 20,447 | 9,354 | 37 | 0 | 0 | 6 | 9 | 13 | 16 | 9 | 3 | 1 | 0 | 0 |
| 1013 | BUY | 44.6 | 48.0 | 37 | 20,447 | 9,354 | 37 | 0 | 0 | 2 | 6 | 6 | 11 | 9 | 2 | 1 | 0 | 0 |
| 2007 | ALL | 39.8 | 40.0 | 15 | 22,704 | 21,525 | 8 | 0 | 0 | 1 | 0 | 7 | 5 | 2 | 0 | 0 | 0 | 0 |
| 2010 | ALL | 37.1 | 39.5 | 10 | 15,569 | 8,963 | 8 | 0 | 0 | 2 | 2 | 1 | 3 | 2 | 0 | 0 | 0 | 0 |
| 2011 | ALL | 46.8 | 48.5 | 12 | 7,985 | 8,000 | 9 | 0 | 0 | 1 | 0 | 2 | 5 | 3 | 1 | 0 | 0 | 0 |
| 2012 | ALL | 38.9 | 38.0 | 19 | 28,996 | 14,252 | 10 | 0 | 0 | 2 | 5 | 5 | 3 | 2 | 1 | 1 | 0 | 0 |
| 2013 | ALL | 42.1 | 42.5 | 16 | 27,015 | 13,563 | 10 | 0 | 0 | 1 | 2 | 5 | 5 | 2 | 1 | 0 | 0 | 0 |
| R. M. Beckett | ||||||||||||||||||
| YEAR | TYPE | MEAN RTG |
MEDN RTG |
TOT RTD |
SALE MEAN (£) |
SALE MEDN (£) |
BUY TOT |
< 1 | 1- 10 |
11- 20 |
21- 30 |
31- 40 |
41- 50 |
51- 60 |
61- 70 |
71- 80 |
81- 90 |
91- 100 |
| 1013 | ALL | 44.1 | 45.0 | 115 | 35,345 | 26,250 | 72 | 2 | 0 | 2 | 13 | 21 | 39 | 30 | 7 | 1 | 0 | 0 |
| 1013 | BUY | 45.9 | 49.0 | 72 | 35,345 | 26,250 | 72 | 2 | 0 | 2 | 4 | 11 | 23 | 24 | 5 | 1 | 0 | 0 |
| 2007 | ALL | 46.6 | 45.0 | 29 | 16,737 | 14,175 | 20 | 0 | 1 | 0 | 2 | 3 | 15 | 4 | 2 | 2 | 0 | 0 |
| 2010 | ALL | 45.3 | 45.0 | 43 | 34,787 | 28,350 | 31 | 0 | 0 | 0 | 3 | 10 | 16 | 11 | 2 | 1 | 0 | 0 |
| 2011 | ALL | 48.0 | 50.0 | 21 | 35,353 | 23,100 | 12 | 0 | 0 | 2 | 1 | 1 | 8 | 6 | 3 | 0 | 0 | 0 |
| 2012 | ALL | 44.7 | 47.0 | 29 | 43,213 | 24,125 | 16 | 1 | 0 | 0 | 4 | 4 | 8 | 10 | 2 | 0 | 0 | 0 |
| 2013 | ALL | 37.3 | 39.5 | 22 | 26,983 | 30,450 | 13 | 1 | 0 | 0 | 5 | 6 | 7 | 3 | 0 | 0 | 0 | 0 |
| M. L. W. Bell | ||||||||||||||||||
| YEAR | TYPE | MEAN RTG |
MEDN RTG |
TOT RTD |
SALE MEAN (£) |
SALE MEDN (£) |
BUY TOT |
< 1 | 1- 10 |
11- 20 |
21- 30 |
31- 40 |
41- 50 |
51- 60 |
61- 70 |
71- 80 |
81- 90 |
91- 100 |
| 1013 | ALL | 37.4 | 40.0 | 103 | 63,376 | 48,765 | 55 | 4 | 4 | 5 | 18 | 25 | 24 | 18 | 3 | 2 | 0 | 0 |
| 1013 | BUY | 38.6 | 40.0 | 55 | 63,376 | 48,765 | 55 | 2 | 3 | 1 | 10 | 14 | 12 | 9 | 2 | 2 | 0 | 0 |
| 2007 | ALL | 43.2 | 48.0 | 30 | 65,807 | 52,810 | 14 | 0 | 1 | 1 | 4 | 4 | 8 | 10 | 2 | 0 | 0 | 0 |
| 2010 | ALL | 37.8 | 38.0 | 32 | 77,672 | 48,765 | 15 | 1 | 0 | 1 | 10 | 5 | 8 | 5 | 1 | 1 | 0 | 0 |
| 2011 | ALL | 37.3 | 45.5 | 14 | 47,739 | 34,000 | 9 | 1 | 3 | 0 | 0 | 1 | 4 | 4 | 1 | 0 | 0 | 0 |
| 2012 | ALL | 39.7 | 38.0 | 31 | 65,066 | 52,000 | 19 | 0 | 0 | 2 | 5 | 10 | 8 | 4 | 1 | 1 | 0 | 0 |
| 2013 | ALL | 34.3 | 39.0 | 26 | 54,557 | 45,009 | 12 | 2 | 1 | 2 | 3 | 9 | 4 | 5 | 0 | 0 | 0 | 0 |
| M. Botti | ||||||||||||||||||
| YEAR | TYPE | MEAN RTG |
MEDN RTG |
TOT RTD |
SALE MEAN (£) |
SALE MEDN (£) |
BUY TOT |
< 1 | 1- 10 |
11- 20 |
21- 30 |
31- 40 |
41- 50 |
51- 60 |
61- 70 |
71- 80 |
81- 90 |
91- 100 |
| 1013 | ALL | 42.3 | 42.0 | 77 | 51,891 | 31,500 | 49 | 1 | 1 | 3 | 5 | 22 | 26 | 11 | 7 | 0 | 1 | 0 |
| 1013 | BUY | 47.2 | 47.0 | 49 | 51,891 | 31,500 | 49 | 0 | 0 | 0 | 3 | 11 | 17 | 10 | 7 | 0 | 1 | 0 |
| 2007 | ALL | 35.8 | 35.5 | 8 | 30,348 | 31,500 | 7 | 0 | 0 | 1 | 2 | 3 | 1 | 0 | 1 | 0 | 0 | 0 |
| 2010 | ALL | 44.3 | 46.5 | 12 | 17,641 | 19,450 | 8 | 0 | 1 | 0 | 0 | 3 | 5 | 0 | 3 | 0 | 0 | 0 |
| 2011 | ALL | 47.0 | 48.0 | 13 | 30,181 | 18,000 | 9 | 0 | 0 | 0 | 0 | 3 | 6 | 3 | 1 | 0 | 0 | 0 |
| 2012 | ALL | 43.3 | 42.0 | 25 | 52,224 | 42,517 | 17 | 0 | 0 | 1 | 2 | 8 | 7 | 4 | 2 | 0 | 1 | 0 |
| 2013 | ALL | 38.2 | 40.0 | 27 | 82,808 | 42,000 | 15 | 1 | 0 | 2 | 3 | 8 | 8 | 4 | 1 | 0 | 0 | 0 |
| C. E. Brittain | ||||||||||||||||||
| YEAR | TYPE | MEAN RTG |
MEDN RTG |
TOT RTD |
SALE MEAN (£) |
SALE MEDN (£) |
BUY TOT |
< 1 | 1- 10 |
11- 20 |
21- 30 |
31- 40 |
41- 50 |
51- 60 |
61- 70 |
71- 80 |
81- 90 |
91- 100 |
| 1013 | ALL | 44.5 | 45.0 | 84 | 46,008 | 33,600 | 53 | 0 | 2 | 6 | 4 | 19 | 20 | 20 | 9 | 4 | 0 | 0 |
| 1013 | BUY | 49.4 | 51.0 | 53 | 46,008 | 33,600 | 53 | 0 | 1 | 3 | 2 | 6 | 13 | 15 | 9 | 4 | 0 | 0 |
| 2007 | ALL | 47.2 | 54.0 | 32 | 48,016 | 31,500 | 20 | 0 | 2 | 1 | 3 | 6 | 2 | 10 | 5 | 3 | 0 | 0 |
| 2010 | ALL | 46.5 | 47.0 | 31 | 63,838 | 52,500 | 21 | 0 | 1 | 0 | 2 | 6 | 8 | 9 | 3 | 2 | 0 | 0 |
| 2011 | ALL | 44.2 | 48.0 | 20 | 30,577 | 26,775 | 14 | 0 | 0 | 3 | 2 | 4 | 3 | 3 | 4 | 1 | 0 | 0 |
| 2012 | ALL | 35.2 | 40.0 | 13 | 35,175 | 29,400 | 6 | 0 | 1 | 3 | 0 | 3 | 3 | 3 | 0 | 0 | 0 | 0 |
| 2013 | ALL | 47.8 | 43.5 | 20 | 38,226 | 40,425 | 12 | 0 | 0 | 0 | 0 | 6 | 6 | 5 | 2 | 1 | 0 | 0 |
| D. H. Brown | ||||||||||||||||||
| YEAR | TYPE | MEAN RTG |
MEDN RTG |
TOT RTD |
SALE MEAN (£) |
SALE MEDN (£) |
BUY TOT |
< 1 | 1- 10 |
11- 20 |
21- 30 |
31- 40 |
41- 50 |
51- 60 |
61- 70 |
71- 80 |
81- 90 |
91- 100 |
| 1013 | ALL | 44.5 | 48.0 | 45 | 48,535 | 30,000 | 29 | 2 | 0 | 0 | 8 | 6 | 11 | 8 | 8 | 1 | 1 | 0 |
| 1013 | BUY | 48.5 | 49.0 | 29 | 48,535 | 30,000 | 29 | 0 | 0 | 0 | 3 | 5 | 7 | 6 | 7 | 1 | 0 | 0 |
| 2010 | ALL | 40.6 | 41.0 | 9 | 16,630 | 14,000 | 5 | 1 | 0 | 0 | 1 | 2 | 1 | 2 | 1 | 1 | 0 | 0 |
| 2011 | ALL | 44.1 | 45.0 | 9 | 15,450 | 13,125 | 4 | 0 | 0 | 0 | 3 | 0 | 4 | 1 | 0 | 0 | 1 | 0 |
| 2012 | ALL | 49.5 | 48.0 | 15 | 60,388 | 35,000 | 11 | 0 | 0 | 0 | 1 | 3 | 4 | 3 | 4 | 0 | 0 | 0 |
| 2013 | ALL | 41.4 | 46.0 | 12 | 66,479 | 42,000 | 9 | 1 | 0 | 0 | 3 | 1 | 2 | 2 | 3 | 0 | 0 | 0 |
| E. M. Burke | ||||||||||||||||||
| YEAR | TYPE | MEAN RTG |
MEDN RTG |
TOT RTD |
SALE MEAN (£) |
SALE MEDN (£) |
BUY TOT |
< 1 | 1- 10 |
11- 20 |
21- 30 |
31- 40 |
41- 50 |
51- 60 |
61- 70 |
71- 80 |
81- 90 |
91- 100 |
| 1013 | ALL | 41.2 | 42.0 | 46 | 17,510 | 10,000 | 29 | 0 | 1 | 2 | 6 | 11 | 14 | 11 | 1 | 0 | 0 | 0 |
| 1013 | BUY | 41.3 | 41.0 | 29 | 17,510 | 10,000 | 29 | 0 | 1 | 1 | 4 | 8 | 6 | 8 | 1 | 0 | 0 | 0 |
| 2010 | ALL | 31.0 | 31.0 | 1 | 0, | 0, | 0 | 0 | 0 | 0 | 0 | 1 | 0 | 0 | 0 | 0 | 0 | 0 |
| 2011 | ALL | 42.7 | 47.0 | 11 | 8,480 | 7,228 | 7 | 0 | 1 | 0 | 0 | 3 | 5 | 2 | 0 | 0 | 0 | 0 |
| 2012 | ALL | 44.6 | 47.0 | 19 | 18,655 | 10,289 | 12 | 0 | 0 | 0 | 2 | 4 | 7 | 5 | 1 | 0 | 0 | 0 |
| 2013 | ALL | 36.3 | 33.0 | 15 | 22,456 | 10,204 | 10 | 0 | 0 | 2 | 4 | 3 | 2 | 4 | 0 | 0 | 0 | 0 |
| H. Candy | ||||||||||||||||||
| YEAR | TYPE | MEAN RTG |
MEDN RTG |
TOT RTD |
SALE MEAN (£) |
SALE MEDN (£) |
BUY TOT |
< 1 | 1- 10 |
11- 20 |
21- 30 |
31- 40 |
41- 50 |
51- 60 |
61- 70 |
71- 80 |
81- 90 |
91- 100 |
| 1013 | ALL | 43.8 | 42.5 | 44 | 17,146 | 10,000 | 27 | 0 | 2 | 1 | 5 | 12 | 10 | 8 | 4 | 2 | 0 | 0 |
| 1013 | BUY | 47.6 | 47.0 | 27 | 17,146 | 10,000 | 27 | 0 | 0 | 0 | 3 | 8 | 6 | 5 | 4 | 1 | 0 | 0 |
| 2007 | ALL | 34.1 | 40.0 | 14 | 35,058 | 21,000 | 9 | 1 | 2 | 0 | 3 | 1 | 4 | 3 | 0 | 0 | 0 | 0 |
| 2010 | ALL | 49.3 | 43.0 | 9 | 15,700 | 16,000 | 5 | 0 | 0 | 0 | 1 | 2 | 2 | 2 | 0 | 2 | 0 | 0 |
| 2011 | ALL | 40.7 | 43.0 | 12 | 26,364 | 18,900 | 7 | 0 | 2 | 0 | 1 | 2 | 4 | 2 | 1 | 0 | 0 | 0 |
| 2012 | ALL | 47.8 | 48.5 | 8 | 15,126 | 6,463 | 6 | 0 | 0 | 0 | 0 | 3 | 2 | 2 | 1 | 0 | 0 | 0 |
| 2013 | ALL | 40.9 | 39.0 | 15 | 12,125 | 9,000 | 9 | 0 | 0 | 1 | 3 | 5 | 2 | 2 | 2 | 0 | 0 | 0 |
| H. R. A. Cecil | ||||||||||||||||||
| YEAR | TYPE | MEAN RTG |
MEDN RTG |
TOT RTD |
SALE MEAN (£) |
SALE MEDN (£) |
BUY TOT |
< 1 | 1- 10 |
11- 20 |
21- 30 |
31- 40 |
41- 50 |
51- 60 |
61- 70 |
71- 80 |
81- 90 |
91- 100 |
| 1013 | ALL | 49.0 | 49.0 | 38 | 101,552 | 61,813 | 12 | 0 | 0 | 1 | 2 | 7 | 12 | 9 | 5 | 1 | 0 | 1 |
| 1013 | BUY | 48.8 | 48.5 | 12 | 101,552 | 61,813 | 12 | 0 | 0 | 0 | 1 | 2 | 4 | 2 | 3 | 0 | 0 | 0 |
| 2007 | ALL | 54.1 | 57.0 | 14 | 119,095 | 42,000 | 5 | 0 | 0 | 1 | 0 | 2 | 2 | 3 | 4 | 2 | 0 | 0 |
| 2010 | ALL | 50.4 | 53.0 | 11 | 52,850 | 68,250 | 3 | 0 | 0 | 0 | 2 | 2 | 1 | 4 | 1 | 0 | 0 | 1 |
| 2011 | ALL | 48.6 | 49.0 | 14 | 139,353 | 47,619 | 5 | 0 | 0 | 1 | 0 | 2 | 4 | 4 | 3 | 0 | 0 | 0 |
| 2012 | ALL | 49.0 | 49.0 | 6 | 63,776 | 63,776 | 1 | 0 | 0 | 0 | 0 | 1 | 4 | 0 | 1 | 0 | 0 | 0 |
| 2013 | ALL | 47.4 | 42.0 | 7 | 99,843 | 59,850 | 3 | 0 | 0 | 0 | 0 | 2 | 3 | 1 | 0 | 1 | 0 | 0 |
| M. R. Channon | ||||||||||||||||||
| YEAR | TYPE | MEAN RTG |
MEDN RTG |
TOT RTD |
SALE MEAN (£) |
SALE MEDN (£) |
BUY TOT |
< 1 | 1- 10 |
11- 20 |
21- 30 |
31- 40 |
41- 50 |
51- 60 |
61- 70 |
71- 80 |
81- 90 |
91- 100 |
| 1013 | ALL | 43.8 | 45.0 | 248 | 33,253 | 26,250 | 153 | 2 | 3 | 12 | 29 | 45 | 74 | 48 | 29 | 5 | 1 | 0 |
| 1013 | BUY | 47.7 | 48.0 | 153 | 33,253 | 26,250 | 153 | 1 | 1 | 4 | 11 | 21 | 48 | 39 | 22 | 5 | 1 | 0 |
| 2007 | ALL | 45.0 | 46.5 | 76 | 50,047 | 36,750 | 53 | 2 | 3 | 6 | 6 | 13 | 13 | 13 | 15 | 3 | 1 | 1 |
| 2010 | ALL | 43.9 | 44.0 | 70 | 27,123 | 25,000 | 42 | 1 | 0 | 3 | 8 | 13 | 21 | 14 | 8 | 1 | 1 | 0 |
| 2011 | ALL | 46.6 | 46.0 | 61 | 32,230 | 21,000 | 45 | 0 | 0 | 3 | 7 | 8 | 18 | 15 | 8 | 2 | 0 | 0 |
| 2012 | ALL | 44.3 | 43.5 | 58 | 38,539 | 30,006 | 36 | 0 | 0 | 4 | 6 | 12 | 16 | 10 | 9 | 1 | 0 | 0 |
| 2013 | ALL | 40.3 | 44.0 | 59 | 37,026 | 25,625 | 30 | 1 | 3 | 2 | 8 | 12 | 19 | 9 | 4 | 1 | 0 | 0 |
| R. Charlton | ||||||||||||||||||
| YEAR | TYPE | MEAN RTG |
MEDN RTG |
TOT RTD |
SALE MEAN (£) |
SALE MEDN (£) |
BUY TOT |
< 1 | 1- 10 |
11- 20 |
21- 30 |
31- 40 |
41- 50 |
51- 60 |
61- 70 |
71- 80 |
81- 90 |
91- 100 |
| 1013 | ALL | 40.8 | 43.0 | 73 | 43,094 | 25,000 | 19 | 3 | 0 | 4 | 9 | 15 | 21 | 15 | 4 | 2 | 0 | 0 |
| 1013 | BUY | 35.3 | 38.0 | 19 | 43,094 | 25,000 | 19 | 3 | 0 | 1 | 1 | 6 | 3 | 3 | 1 | 1 | 0 | 0 |
| 2007 | ALL | 45.0 | 45.0 | 25 | 79,867 | 63,000 | 9 | 0 | 1 | 1 | 2 | 4 | 8 | 5 | 3 | 1 | 0 | 0 |
| 2010 | ALL | 35.9 | 37.0 | 16 | 67,158 | 70,350 | 5 | 1 | 0 | 2 | 3 | 4 | 2 | 3 | 1 | 0 | 0 | 0 |
| 2011 | ALL | 43.0 | 48.0 | 22 | 35,040 | 23,500 | 10 | 2 | 0 | 0 | 2 | 3 | 7 | 4 | 3 | 1 | 0 | 0 |
| 2012 | ALL | 43.8 | 44.0 | 16 | 15,000 | 15,000 | 1 | 0 | 0 | 1 | 2 | 2 | 6 | 4 | 0 | 1 | 0 | 0 |
| 2013 | ALL | 39.7 | 41.0 | 19 | 39,200 | 22,050 | 3 | 0 | 0 | 1 | 2 | 6 | 6 | 4 | 0 | 0 | 0 | 0 |
| P. F. I. Cole | ||||||||||||||||||
| YEAR | TYPE | MEAN RTG |
MEDN RTG |
TOT RTD |
SALE MEAN (£) |
SALE MEDN (£) |
BUY TOT |
< 1 | 1- 10 |
11- 20 |
21- 30 |
31- 40 |
41- 50 |
51- 60 |
61- 70 |
71- 80 |
81- 90 |
91- 100 |
| 1013 | ALL | 44.2 | 45.0 | 67 | 54,863 | 37,375 | 40 | 1 | 0 | 3 | 10 | 12 | 18 | 11 | 9 | 3 | 0 | 0 |
| 1013 | BUY | 48.0 | 47.5 | 40 | 54,863 | 37,375 | 40 | 0 | 0 | 0 | 5 | 7 | 11 | 8 | 7 | 2 | 0 | 0 |
| 2007 | ALL | 48.3 | 46.0 | 25 | 71,394 | 57,750 | 17 | 0 | 0 | 1 | 3 | 4 | 8 | 3 | 2 | 3 | 0 | 1 |
| 2010 | ALL | 49.0 | 50.0 | 22 | 57,125 | 63,000 | 11 | 0 | 0 | 1 | 2 | 2 | 8 | 3 | 5 | 1 | 0 | 0 |
| 2011 | ALL | 47.9 | 47.0 | 15 | 64,365 | 43,050 | 10 | 0 | 0 | 1 | 1 | 4 | 2 | 2 | 4 | 1 | 0 | 0 |
| 2012 | ALL | 39.9 | 39.5 | 14 | 59,583 | 32,550 | 10 | 0 | 0 | 0 | 3 | 5 | 3 | 3 | 0 | 0 | 0 | 0 |
| 2013 | ALL | 38.0 | 43.5 | 16 | 36,294 | 28,350 | 9 | 1 | 0 | 1 | 4 | 1 | 5 | 3 | 0 | 1 | 0 | 0 |
| C. G. Cox | ||||||||||||||||||
| YEAR | TYPE | MEAN RTG |
MEDN RTG |
TOT RTD |
SALE MEAN (£) |
SALE MEDN (£) |
BUY TOT |
< 1 | 1- 10 |
11- 20 |
21- 30 |
31- 40 |
41- 50 |
51- 60 |
61- 70 |
71- 80 |
81- 90 |
91- 100 |
| 1013 | ALL | 44.6 | 43.0 | 79 | 30,349 | 22,959 | 47 | 1 | 0 | 3 | 3 | 23 | 26 | 13 | 7 | 2 | 1 | 0 |
| 1013 | BUY | 45.6 | 44.0 | 47 | 30,349 | 22,959 | 47 | 0 | 0 | 2 | 3 | 12 | 16 | 7 | 4 | 2 | 1 | 0 |
| 2007 | ALL | 48.5 | 47.0 | 17 | 58,389 | 44,643 | 14 | 0 | 0 | 1 | 1 | 2 | 6 | 3 | 2 | 2 | 0 | 0 |
| 2010 | ALL | 45.6 | 47.5 | 20 | 21,312 | 17,007 | 9 | 0 | 0 | 1 | 0 | 6 | 6 | 5 | 2 | 0 | 0 | 0 |
| 2011 | ALL | 49.6 | 49.5 | 20 | 24,995 | 25,510 | 11 | 1 | 0 | 0 | 0 | 2 | 8 | 3 | 4 | 2 | 0 | 0 |
| 2012 | ALL | 48.8 | 45.5 | 16 | 40,151 | 16,027 | 12 | 0 | 0 | 0 | 1 | 5 | 4 | 4 | 1 | 0 | 1 | 0 |
| 2013 | ALL | 36.4 | 37.0 | 23 | 31,857 | 22,959 | 15 | 0 | 0 | 2 | 2 | 10 | 8 | 1 | 0 | 0 | 0 | 0 |
| A. C. Coyle | ||||||||||||||||||
| YEAR | TYPE | MEAN RTG |
MEDN RTG |
TOT RTD |
SALE MEAN (£) |
SALE MEDN (£) |
BUY TOT |
< 1 | 1- 10 |
11- 20 |
21- 30 |
31- 40 |
41- 50 |
51- 60 |
61- 70 |
71- 80 |
81- 90 |
91- 100 |
| 1013 | ALL | 35.1 | 35.5 | 18 | 5,695 | 5,750 | 10 | 0 | 1 | 0 | 5 | 7 | 3 | 2 | 0 | 0 | 0 | 0 |
| 1013 | BUY | 37.2 | 37.0 | 10 | 5,695 | 5,750 | 10 | 0 | 1 | 0 | 1 | 4 | 2 | 2 | 0 | 0 | 0 | 0 |
| 2011 | ALL | 38.0 | 38.0 | 1 | 8,503 | 8,503 | 1 | 0 | 0 | 0 | 0 | 1 | 0 | 0 | 0 | 0 | 0 | 0 |
| 2012 | ALL | 32.8 | 36.0 | 5 | 2,100 | 2,100 | 2 | 0 | 0 | 0 | 2 | 2 | 1 | 0 | 0 | 0 | 0 | 0 |
| 2013 | ALL | 35.8 | 35.0 | 12 | 6,321 | 6,000 | 7 | 0 | 1 | 0 | 3 | 4 | 2 | 2 | 0 | 0 | 0 | 0 |
| L. M. Cumani | ||||||||||||||||||
| YEAR | TYPE | MEAN RTG |
MEDN RTG |
TOT RTD |
SALE MEAN (£) |
SALE MEDN (£) |
BUY TOT |
< 1 | 1- 10 |
11- 20 |
21- 30 |
31- 40 |
41- 50 |
51- 60 |
61- 70 |
71- 80 |
81- 90 |
91- 100 |
| 1013 | ALL | 43.9 | 46.5 | 56 | 84,857 | 66,675 | 30 | 1 | 2 | 2 | 5 | 6 | 23 | 11 | 4 | 2 | 0 | 0 |
| 1013 | BUY | 47.2 | 49.5 | 30 | 84,857 | 66,675 | 30 | 0 | 2 | 1 | 0 | 2 | 13 | 8 | 3 | 1 | 0 | 0 |
| 2007 | ALL | 47.0 | 48.5 | 14 | 61,021 | 27,300 | 5 | 0 | 0 | 0 | 0 | 4 | 5 | 4 | 1 | 0 | 0 | 0 |
| 2010 | ALL | 40.3 | 43.0 | 15 | 44,764 | 33,000 | 7 | 1 | 1 | 0 | 1 | 2 | 7 | 1 | 1 | 1 | 0 | 0 |
| 2011 | ALL | 50.5 | 50.0 | 15 | 73,236 | 73,500 | 8 | 0 | 0 | 0 | 2 | 0 | 6 | 6 | 0 | 1 | 0 | 0 |
| 2012 | ALL | 42.5 | 45.0 | 15 | 90,286 | 75,075 | 10 | 0 | 1 | 1 | 0 | 3 | 6 | 2 | 2 | 0 | 0 | 0 |
| 2013 | ALL | 41.7 | 45.0 | 11 | 148,722 | 114,796 | 5 | 0 | 0 | 1 | 2 | 1 | 4 | 2 | 1 | 0 | 0 | 0 |
| K. W. Dalgleish | ||||||||||||||||||
| YEAR | TYPE | MEAN RTG |
MEDN RTG |
TOT RTD |
SALE MEAN (£) |
SALE MEDN (£) |
BUY TOT |
< 1 | 1- 10 |
11- 20 |
21- 30 |
31- 40 |
41- 50 |
51- 60 |
61- 70 |
71- 80 |
81- 90 |
91- 100 |
| 1013 | ALL | 34.6 | 37.0 | 39 | 9,753 | 6,901 | 18 | 1 | 5 | 2 | 3 | 14 | 9 | 4 | 0 | 1 | 0 | 0 |
| 1013 | BUY | 33.8 | 34.0 | 18 | 9,753 | 6,901 | 18 | 0 | 1 | 1 | 3 | 8 | 5 | 0 | 0 | 0 | 0 | 0 |
| 2011 | ALL | 40.3 | 52.5 | 6 | 0, | 0, | 0 | 1 | 1 | 0 | 0 | 0 | 0 | 3 | 0 | 1 | 0 | 0 |
| 2012 | ALL | 32.6 | 33.0 | 12 | 10,179 | 6,750 | 6 | 0 | 1 | 1 | 2 | 5 | 3 | 0 | 0 | 0 | 0 | 0 |
| 2013 | ALL | 34.1 | 37.0 | 21 | 9,540 | 7,440 | 12 | 0 | 3 | 1 | 1 | 9 | 6 | 1 | 0 | 0 | 0 | 0 |
| T. G. Dascombe | ||||||||||||||||||
| YEAR | TYPE | MEAN RTG |
MEDN RTG |
TOT RTD |
SALE MEAN (£) |
SALE MEDN (£) |
BUY TOT |
< 1 | 1- 10 |
11- 20 |
21- 30 |
31- 40 |
41- 50 |
51- 60 |
61- 70 |
71- 80 |
81- 90 |
91- 100 |
| 1013 | ALL | 41.2 | 42.0 | 124 | 28,421 | 25,510 | 101 | 3 | 3 | 5 | 11 | 34 | 34 | 22 | 11 | 1 | 0 | 0 |
| 1013 | BUY | 43.3 | 44.0 | 101 | 28,421 | 25,510 | 101 | 1 | 1 | 4 | 10 | 23 | 32 | 19 | 10 | 1 | 0 | 0 |
| 2007 | ALL | 42.8 | 41.0 | 8 | 17,414 | 17,850 | 5 | 0 | 0 | 1 | 1 | 2 | 2 | 0 | 2 | 0 | 0 | 0 |
| 2010 | ALL | 39.5 | 40.0 | 34 | 23,027 | 19,950 | 29 | 1 | 1 | 1 | 4 | 10 | 9 | 7 | 1 | 0 | 0 | 0 |
| 2011 | ALL | 44.0 | 45.0 | 33 | 30,440 | 25,255 | 28 | 1 | 0 | 1 | 3 | 7 | 9 | 7 | 5 | 0 | 0 | 0 |
| 2012 | ALL | 40.4 | 42.0 | 30 | 28,941 | 28,912 | 23 | 0 | 2 | 2 | 4 | 5 | 10 | 3 | 3 | 1 | 0 | 0 |
| 2013 | ALL | 41.0 | 40.0 | 27 | 32,609 | 30,000 | 21 | 1 | 0 | 1 | 0 | 12 | 6 | 5 | 2 | 0 | 0 | 0 |
| A. Duffield | ||||||||||||||||||
| YEAR | TYPE | MEAN RTG |
MEDN RTG |
TOT RTD |
SALE MEAN (£) |
SALE MEDN (£) |
BUY TOT |
< 1 | 1- 10 |
11- 20 |
21- 30 |
31- 40 |
41- 50 |
51- 60 |
61- 70 |
71- 80 |
81- 90 |
91- 100 |
| 1013 | ALL | 32.5 | 34.0 | 85 | 12,121 | 10,250 | 58 | 5 | 4 | 7 | 16 | 25 | 16 | 8 | 4 | 0 | 0 | 0 |
| 1013 | BUY | 36.8 | 38.0 | 58 | 12,121 | 10,250 | 58 | 2 | 0 | 5 | 9 | 17 | 14 | 8 | 3 | 0 | 0 | 0 |
| 2007 | ALL | 32.5 | 31.0 | 17 | 28,201 | 21,000 | 10 | 0 | 2 | 2 | 4 | 4 | 3 | 2 | 0 | 0 | 0 | 0 |
| 2010 | ALL | 36.2 | 42.0 | 20 | 15,290 | 14,000 | 15 | 2 | 1 | 1 | 3 | 3 | 3 | 5 | 2 | 0 | 0 | 0 |
| 2011 | ALL | 32.1 | 34.0 | 23 | 10,907 | 8,700 | 16 | 1 | 2 | 1 | 2 | 12 | 3 | 1 | 1 | 0 | 0 | 0 |
| 2012 | ALL | 30.7 | 34.5 | 26 | 11,625 | 11,000 | 16 | 2 | 1 | 2 | 5 | 6 | 9 | 0 | 1 | 0 | 0 | 0 |
| 2013 | ALL | 31.3 | 29.0 | 16 | 10,288 | 10,000 | 11 | 0 | 0 | 3 | 6 | 4 | 1 | 2 | 0 | 0 | 0 | 0 |
| E. A. L. Dunlop | ||||||||||||||||||
| YEAR | TYPE | MEAN RTG |
MEDN RTG |
TOT RTD |
SALE MEAN (£) |
SALE MEDN (£) |
BUY TOT |
< 1 | 1- 10 |
11- 20 |
21- 30 |
31- 40 |
41- 50 |
51- 60 |
61- 70 |
71- 80 |
81- 90 |
91- 100 |
| 1013 | ALL | 40.6 | 39.0 | 104 | 89,343 | 57,750 | 59 | 0 | 2 | 5 | 17 | 31 | 24 | 15 | 8 | 2 | 0 | 0 |
| 1013 | BUY | 43.3 | 43.0 | 59 | 89,343 | 57,750 | 59 | 0 | 1 | 0 | 9 | 18 | 12 | 12 | 6 | 1 | 0 | 0 |
| 2007 | ALL | 43.8 | 44.5 | 28 | 70,285 | 57,750 | 20 | 1 | 0 | 0 | 1 | 9 | 9 | 5 | 2 | 1 | 0 | 0 |
| 2010 | ALL | 41.0 | 39.5 | 30 | 48,676 | 33,600 | 17 | 0 | 1 | 1 | 3 | 11 | 7 | 4 | 2 | 1 | 0 | 0 |
| 2011 | ALL | 41.5 | 40.0 | 24 | 68,642 | 49,875 | 12 | 0 | 1 | 2 | 2 | 7 | 4 | 5 | 2 | 1 | 0 | 0 |
| 2012 | ALL | 39.0 | 39.5 | 26 | 97,279 | 68,027 | 15 | 0 | 0 | 2 | 4 | 8 | 8 | 2 | 2 | 0 | 0 | 0 |
| 2013 | ALL | 40.9 | 36.5 | 24 | 144,057 | 94,500 | 15 | 0 | 0 | 0 | 8 | 5 | 5 | 4 | 2 | 0 | 0 | 0 |
| M. W. Easterby | ||||||||||||||||||
| YEAR | TYPE | MEAN RTG |
MEDN RTG |
TOT RTD |
SALE MEAN (£) |
SALE MEDN (£) |
BUY TOT |
< 1 | 1- 10 |
11- 20 |
21- 30 |
31- 40 |
41- 50 |
51- 60 |
61- 70 |
71- 80 |
81- 90 |
91- 100 |
| 1013 | ALL | 28.6 | 27.5 | 64 | 7,873 | 6,000 | 35 | 3 | 1 | 16 | 14 | 17 | 9 | 4 | 0 | 0 | 0 | 0 |
| 1013 | BUY | 29.9 | 31.0 | 35 | 7,873 | 6,000 | 35 | 1 | 0 | 8 | 8 | 12 | 3 | 3 | 0 | 0 | 0 | 0 |
| 2007 | ALL | 12.9 | 14.0 | 27 | 12,907 | 8,400 | 13 | 8 | 4 | 6 | 6 | 0 | 2 | 0 | 0 | 1 | 0 | 0 |
| 2010 | ALL | 28.9 | 31.5 | 16 | 4,119 | 3,518 | 6 | 1 | 0 | 5 | 2 | 4 | 4 | 0 | 0 | 0 | 0 | 0 |
| 2011 | ALL | 33.1 | 33.0 | 21 | 10,161 | 6,000 | 11 | 1 | 0 | 3 | 4 | 7 | 3 | 3 | 0 | 0 | 0 | 0 |
| 2012 | ALL | 27.0 | 24.0 | 15 | 5,990 | 5,500 | 10 | 1 | 0 | 3 | 6 | 2 | 2 | 1 | 0 | 0 | 0 | 0 |
| 2013 | ALL | 22.6 | 21.5 | 12 | 9,894 | 8,000 | 8 | 0 | 1 | 5 | 2 | 4 | 0 | 0 | 0 | 0 | 0 | 0 |
| T. D. Easterby | ||||||||||||||||||
| YEAR | TYPE | MEAN RTG |
MEDN RTG |
TOT RTD |
SALE MEAN (£) |
SALE MEDN (£) |
BUY TOT |
< 1 | 1- 10 |
11- 20 |
21- 30 |
31- 40 |
41- 50 |
51- 60 |
61- 70 |
71- 80 |
81- 90 |
91- 100 |
| 1013 | ALL | 33.6 | 35.0 | 173 | 10,918 | 8,502 | 118 | 10 | 7 | 17 | 38 | 42 | 25 | 20 | 13 | 1 | 0 | 0 |
| 1013 | BUY | 38.7 | 38.0 | 118 | 10,918 | 8,502 | 118 | 1 | 4 | 5 | 28 | 29 | 22 | 18 | 10 | 1 | 0 | 0 |
| 2007 | ALL | 32.7 | 36.0 | 37 | 20,267 | 18,279 | 26 | 0 | 4 | 4 | 8 | 8 | 10 | 2 | 1 | 0 | 0 | 0 |
| 2010 | ALL | 38.4 | 38.0 | 41 | 10,429 | 7,875 | 33 | 1 | 2 | 3 | 7 | 11 | 4 | 9 | 3 | 1 | 0 | 0 |
| 2011 | ALL | 35.8 | 36.0 | 45 | 10,804 | 7,875 | 35 | 2 | 2 | 2 | 12 | 9 | 7 | 5 | 6 | 0 | 0 | 0 |
| 2012 | ALL | 30.1 | 33.5 | 52 | 9,670 | 8,738 | 30 | 5 | 2 | 6 | 10 | 15 | 10 | 2 | 2 | 0 | 0 | 0 |
| 2013 | ALL | 30.5 | 30.0 | 35 | 13,794 | 13,803 | 20 | 2 | 1 | 6 | 9 | 7 | 4 | 4 | 2 | 0 | 0 | 0 |
| P. D. Evans | ||||||||||||||||||
| YEAR | TYPE | MEAN RTG |
MEDN RTG |
TOT RTD |
SALE MEAN (£) |
SALE MEDN (£) |
BUY TOT |
< 1 | 1- 10 |
11- 20 |
21- 30 |
31- 40 |
41- 50 |
51- 60 |
61- 70 |
71- 80 |
81- 90 |
91- 100 |
| 1013 | ALL | 32.3 | 33.0 | 114 | 11,535 | 9,354 | 77 | 6 | 5 | 15 | 23 | 23 | 20 | 17 | 5 | 0 | 0 | 0 |
| 1013 | BUY | 37.2 | 36.0 | 77 | 11,535 | 9,354 | 77 | 1 | 3 | 7 | 14 | 20 | 13 | 14 | 5 | 0 | 0 | 0 |
| 2007 | ALL | 33.1 | 29.0 | 21 | 10,869 | 9,450 | 17 | 0 | 2 | 2 | 9 | 3 | 2 | 0 | 2 | 1 | 0 | 0 |
| 2010 | ALL | 34.0 | 32.0 | 33 | 10,128 | 9,725 | 22 | 2 | 1 | 3 | 7 | 7 | 5 | 5 | 3 | 0 | 0 | 0 |
| 2011 | ALL | 31.3 | 35.5 | 42 | 13,855 | 9,991 | 28 | 3 | 1 | 5 | 9 | 8 | 7 | 8 | 1 | 0 | 0 | 0 |
| 2012 | ALL | 27.0 | 24.0 | 13 | 6,475 | 3,000 | 7 | 0 | 1 | 5 | 2 | 3 | 1 | 1 | 0 | 0 | 0 | 0 |
| 2013 | ALL | 34.4 | 35.5 | 26 | 11,605 | 7,151 | 20 | 1 | 2 | 2 | 5 | 5 | 7 | 3 | 1 | 0 | 0 | 0 |
| R. A. Fahey | ||||||||||||||||||
| YEAR | TYPE | MEAN RTG |
MEDN RTG |
TOT RTD |
SALE MEAN (£) |
SALE MEDN (£) |
BUY TOT |
< 1 | 1- 10 |
11- 20 |
21- 30 |
31- 40 |
41- 50 |
51- 60 |
61- 70 |
71- 80 |
81- 90 |
91- 100 |
| 1013 | ALL | 44.6 | 44.5 | 276 | 37,123 | 27,300 | 187 | 1 | 1 | 11 | 29 | 57 | 92 | 50 | 27 | 7 | 1 | 0 |
| 1013 | BUY | 47.0 | 46.0 | 187 | 37,123 | 27,300 | 187 | 0 | 0 | 4 | 16 | 36 | 63 | 38 | 22 | 7 | 1 | 0 |
| 2007 | ALL | 37.4 | 35.0 | 34 | 27,711 | 26,250 | 23 | 1 | 1 | 3 | 6 | 8 | 7 | 5 | 3 | 0 | 0 | 0 |
| 2010 | ALL | 48.4 | 46.5 | 62 | 38,234 | 25,000 | 41 | 0 | 0 | 2 | 6 | 10 | 17 | 12 | 11 | 3 | 1 | 0 |
| 2011 | ALL | 42.5 | 44.0 | 69 | 43,738 | 29,000 | 41 | 1 | 0 | 4 | 8 | 14 | 22 | 15 | 5 | 0 | 0 | 0 |
| 2012 | ALL | 44.3 | 45.0 | 71 | 34,868 | 28,350 | 54 | 0 | 0 | 2 | 7 | 12 | 34 | 11 | 5 | 0 | 0 | 0 |
| 2013 | ALL | 43.5 | 42.0 | 74 | 33,301 | 27,300 | 51 | 0 | 1 | 3 | 8 | 21 | 19 | 12 | 6 | 4 | 0 | 0 |
| J. G. Given | ||||||||||||||||||
| YEAR | TYPE | MEAN RTG |
MEDN RTG |
TOT RTD |
SALE MEAN (£) |
SALE MEDN (£) |
BUY TOT |
< 1 | 1- 10 |
11- 20 |
21- 30 |
31- 40 |
41- 50 |
51- 60 |
61- 70 |
71- 80 |
81- 90 |
91- 100 |
| 1013 | ALL | 32.2 | 33.0 | 57 | 27,573 | 21,000 | 35 | 0 | 6 | 8 | 11 | 12 | 14 | 4 | 2 | 0 | 0 | 0 |
| 1013 | BUY | 36.4 | 39.0 | 35 | 27,573 | 21,000 | 35 | 0 | 2 | 2 | 6 | 10 | 10 | 4 | 1 | 0 | 0 | 0 |
| 2007 | ALL | 29.4 | 30.5 | 18 | 12,314 | 8,400 | 9 | 2 | 1 | 1 | 5 | 4 | 3 | 1 | 1 | 0 | 0 | 0 |
| 2010 | ALL | 27.1 | 25.0 | 21 | 22,551 | 20,503 | 12 | 0 | 4 | 4 | 5 | 1 | 5 | 2 | 0 | 0 | 0 | 0 |
| 2011 | ALL | 36.3 | 37.0 | 15 | 34,908 | 26,250 | 8 | 0 | 0 | 2 | 3 | 5 | 3 | 1 | 1 | 0 | 0 | 0 |
| 2012 | ALL | 36.5 | 39.0 | 8 | 44,550 | 52,000 | 5 | 0 | 1 | 0 | 2 | 2 | 2 | 0 | 1 | 0 | 0 | 0 |
| 2013 | ALL | 32.8 | 33.0 | 13 | 19,242 | 11,000 | 10 | 0 | 1 | 2 | 1 | 4 | 4 | 1 | 0 | 0 | 0 | 0 |
| J. H. M. Gosden | ||||||||||||||||||
| YEAR | TYPE | MEAN RTG |
MEDN RTG |
TOT RTD |
SALE MEAN (£) |
SALE MEDN (£) |
BUY TOT |
< 1 | 1- 10 |
11- 20 |
21- 30 |
31- 40 |
41- 50 |
51- 60 |
61- 70 |
71- 80 |
81- 90 |
91- 100 |
| 1013 | ALL | 47.9 | 48.0 | 144 | 125,220 | 89,250 | 57 | 0 | 0 | 4 | 7 | 27 | 45 | 35 | 21 | 5 | 0 | 0 |
| 1013 | BUY | 46.2 | 48.0 | 57 | 125,220 | 89,250 | 57 | 0 | 0 | 3 | 4 | 11 | 16 | 13 | 9 | 1 | 0 | 0 |
| 2007 | ALL | 56.9 | 57.0 | 29 | 138,102 | 89,625 | 14 | 0 | 0 | 0 | 1 | 3 | 8 | 6 | 7 | 3 | 0 | 0 |
| 2010 | ALL | 50.1 | 51.0 | 40 | 182,406 | 145,769 | 14 | 0 | 0 | 0 | 1 | 6 | 12 | 13 | 6 | 2 | 0 | 0 |
| 2011 | ALL | 52.1 | 52.0 | 36 | 91,284 | 66,500 | 12 | 0 | 0 | 0 | 1 | 5 | 10 | 11 | 7 | 2 | 0 | 0 |
| 2012 | ALL | 46.5 | 46.0 | 36 | 98,917 | 79,800 | 16 | 0 | 0 | 0 | 4 | 6 | 13 | 7 | 5 | 1 | 0 | 0 |
| 2013 | ALL | 41.7 | 43.5 | 32 | 127,052 | 84,000 | 15 | 0 | 0 | 4 | 1 | 10 | 10 | 4 | 3 | 0 | 0 | 0 |
| W. J. Haggas | ||||||||||||||||||
| YEAR | TYPE | MEAN RTG |
MEDN RTG |
TOT RTD |
SALE MEAN (£) |
SALE MEDN (£) |
BUY TOT |
< 1 | 1- 10 |
11- 20 |
21- 30 |
31- 40 |
41- 50 |
51- 60 |
61- 70 |
71- 80 |
81- 90 |
91- 100 |
| 1013 | ALL | 45.0 | 45.0 | 121 | 74,791 | 63,000 | 68 | 0 | 3 | 4 | 13 | 20 | 46 | 16 | 13 | 6 | 0 | 0 |
| 1013 | BUY | 45.5 | 45.5 | 68 | 74,791 | 63,000 | 68 | 0 | 2 | 1 | 8 | 10 | 25 | 11 | 7 | 4 | 0 | 0 |
| 2007 | ALL | 46.2 | 47.0 | 21 | 58,983 | 59,325 | 8 | 0 | 0 | 2 | 1 | 2 | 9 | 4 | 2 | 1 | 0 | 0 |
| 2010 | ALL | 41.6 | 42.0 | 29 | 51,708 | 63,000 | 11 | 0 | 0 | 3 | 4 | 6 | 10 | 3 | 1 | 2 | 0 | 0 |
| 2011 | ALL | 48.2 | 45.0 | 31 | 82,523 | 63,000 | 19 | 0 | 1 | 1 | 3 | 5 | 8 | 5 | 6 | 2 | 0 | 0 |
| 2012 | ALL | 42.9 | 45.0 | 28 | 79,355 | 42,525 | 16 | 0 | 2 | 0 | 3 | 3 | 14 | 3 | 3 | 0 | 0 | 0 |
| 2013 | ALL | 47.0 | 46.0 | 33 | 76,336 | 70,875 | 22 | 0 | 0 | 0 | 3 | 6 | 14 | 5 | 3 | 2 | 0 | 0 |
| R. Hannon | ||||||||||||||||||
| YEAR | TYPE | MEAN RTG |
MEDN RTG |
TOT RTD |
SALE MEAN (£) |
SALE MEDN (£) |
BUY TOT |
< 1 | 1- 10 |
11- 20 |
21- 30 |
31- 40 |
41- 50 |
51- 60 |
61- 70 |
71- 80 |
81- 90 |
91- 100 |
| 1013 | ALL | 48.3 | 49.0 | 575 | 53,401 | 41,475 | 422 | 6 | 9 | 16 | 43 | 77 | 155 | 127 | 108 | 29 | 5 | 0 |
| 1013 | BUY | 50.6 | 51.0 | 422 | 53,401 | 41,475 | 422 | 2 | 6 | 6 | 27 | 50 | 110 | 98 | 92 | 26 | 5 | 0 |
| 2007 | ALL | 48.0 | 49.5 | 100 | 42,931 | 36,750 | 79 | 1 | 2 | 5 | 4 | 18 | 22 | 28 | 12 | 8 | 0 | 0 |
| 2010 | ALL | 48.7 | 49.0 | 130 | 44,743 | 32,000 | 94 | 1 | 2 | 2 | 12 | 17 | 38 | 23 | 27 | 7 | 1 | 0 |
| 2011 | ALL | 50.7 | 51.0 | 147 | 44,995 | 38,000 | 113 | 2 | 2 | 2 | 9 | 16 | 39 | 29 | 30 | 16 | 2 | 0 |
| 2012 | ALL | 48.6 | 50.0 | 144 | 63,164 | 44,609 | 100 | 2 | 3 | 2 | 7 | 21 | 38 | 40 | 26 | 3 | 2 | 0 |
| 2013 | ALL | 45.4 | 45.5 | 154 | 60,248 | 46,769 | 115 | 1 | 2 | 10 | 15 | 23 | 40 | 35 | 25 | 3 | 0 | 0 |
| R. Harris | ||||||||||||||||||
| YEAR | TYPE | MEAN RTG |
MEDN RTG |
TOT RTD |
SALE MEAN (£) |
SALE MEDN (£) |
BUY TOT |
< 1 | 1- 10 |
11- 20 |
21- 30 |
31- 40 |
41- 50 |
51- 60 |
61- 70 |
71- 80 |
81- 90 |
91- 100 |
| 1013 | ALL | 30.4 | 31.5 | 52 | 13,531 | 8,503 | 39 | 1 | 6 | 7 | 11 | 9 | 15 | 2 | 1 | 0 | 0 | 0 |
| 1013 | BUY | 31.3 | 32.0 | 39 | 13,531 | 8,503 | 39 | 0 | 4 | 6 | 8 | 8 | 11 | 2 | 0 | 0 | 0 | 0 |
| 2007 | ALL | 37.7 | 39.5 | 6 | 11,090 | 10,578 | 6 | 0 | 0 | 1 | 0 | 3 | 2 | 0 | 0 | 0 | 0 | 0 |
| 2010 | ALL | 27.7 | 24.0 | 15 | 5,437 | 4,677 | 13 | 0 | 2 | 4 | 3 | 3 | 1 | 2 | 0 | 0 | 0 | 0 |
| 2011 | ALL | 24.3 | 22.0 | 7 | 7,483 | 6,200 | 3 | 0 | 2 | 1 | 3 | 0 | 0 | 0 | 1 | 0 | 0 | 0 |
| 2012 | ALL | 36.4 | 40.0 | 12 | 24,701 | 19,000 | 9 | 0 | 0 | 0 | 4 | 2 | 6 | 0 | 0 | 0 | 0 | 0 |
| 2013 | ALL | 30.9 | 39.0 | 18 | 15,162 | 14,350 | 14 | 1 | 2 | 2 | 1 | 4 | 8 | 0 | 0 | 0 | 0 | 0 |
| C. B. Hills | ||||||||||||||||||
| YEAR | TYPE | MEAN RTG |
MEDN RTG |
TOT RTD |
SALE MEAN (£) |
SALE MEDN (£) |
BUY TOT |
< 1 | 1- 10 |
11- 20 |
21- 30 |
31- 40 |
41- 50 |
51- 60 |
61- 70 |
71- 80 |
81- 90 |
91- 100 |
| 1013 | ALL | 44.2 | 47.0 | 91 | 66,526 | 45,000 | 55 | 0 | 2 | 8 | 7 | 16 | 30 | 13 | 11 | 3 | 1 | 0 |
| 1013 | BUY | 45.5 | 46.0 | 55 | 66,526 | 45,000 | 55 | 0 | 0 | 4 | 4 | 13 | 17 | 6 | 8 | 2 | 1 | 0 |
| 2011 | ALL | 57.3 | 62.0 | 9 | 148,022 | 133,774 | 4 | 0 | 0 | 0 | 0 | 1 | 2 | 1 | 4 | 1 | 0 | 0 |
| 2012 | ALL | 43.5 | 47.0 | 38 | 70,046 | 44,159 | 22 | 0 | 1 | 4 | 0 | 9 | 12 | 8 | 4 | 0 | 0 | 0 |
| 2013 | ALL | 42.1 | 42.0 | 44 | 52,615 | 42,000 | 29 | 0 | 1 | 4 | 7 | 6 | 16 | 4 | 3 | 2 | 1 | 0 |
| Joanna Hughes | ||||||||||||||||||
| YEAR | TYPE | MEAN RTG |
MEDN RTG |
TOT RTD |
SALE MEAN (£) |
SALE MEDN (£) |
BUY TOT |
< 1 | 1- 10 |
11- 20 |
21- 30 |
31- 40 |
41- 50 |
51- 60 |
61- 70 |
71- 80 |
81- 90 |
91- 100 |
| 1013 | ALL | 31.1 | 34.0 | 33 | 11,328 | 5,527 | 22 | 1 | 3 | 4 | 5 | 10 | 8 | 2 | 0 | 0 | 0 | 0 |
| 1013 | BUY | 36.9 | 37.0 | 22 | 11,328 | 5,527 | 22 | 0 | 0 | 1 | 4 | 8 | 8 | 1 | 0 | 0 | 0 | 0 |
| 2011 | ALL | 31.5 | 35.0 | 4 | 24,008 | 29,400 | 3 | 0 | 0 | 1 | 1 | 0 | 2 | 0 | 0 | 0 | 0 | 0 |
| 2012 | ALL | 27.5 | 30.0 | 13 | 6,167 | 5,264 | 8 | 0 | 2 | 3 | 2 | 3 | 3 | 0 | 0 | 0 | 0 | 0 |
| 2013 | ALL | 34.0 | 34.0 | 16 | 11,624 | 5,527 | 11 | 1 | 1 | 0 | 2 | 7 | 3 | 2 | 0 | 0 | 0 | 0 |
| P. W. Chapple-Hyam | ||||||||||||||||||
| YEAR | TYPE | MEAN RTG |
MEDN RTG |
TOT RTD |
SALE MEAN (£) |
SALE MEDN (£) |
BUY TOT |
< 1 | 1- 10 |
11- 20 |
21- 30 |
31- 40 |
41- 50 |
51- 60 |
61- 70 |
71- 80 |
81- 90 |
91- 100 |
| 1013 | ALL | 47.7 | 49.5 | 56 | 37,295 | 27,300 | 33 | 1 | 1 | 0 | 4 | 11 | 12 | 13 | 12 | 2 | 0 | 0 |
| 1013 | BUY | 51.2 | 52.0 | 33 | 37,295 | 27,300 | 33 | 0 | 0 | 0 | 2 | 6 | 7 | 8 | 8 | 2 | 0 | 0 |
| 2007 | ALL | 53.7 | 56.0 | 27 | 67,203 | 65,100 | 17 | 1 | 0 | 0 | 1 | 4 | 7 | 2 | 6 | 4 | 2 | 0 |
| 2010 | ALL | 46.8 | 49.0 | 13 | 28,532 | 26,000 | 8 | 0 | 1 | 0 | 0 | 2 | 5 | 3 | 2 | 0 | 0 | 0 |
| 2011 | ALL | 53.2 | 62.0 | 13 | 35,618 | 36,750 | 7 | 1 | 0 | 0 | 1 | 1 | 1 | 2 | 5 | 2 | 0 | 0 |
| 2012 | ALL | 46.1 | 51.0 | 17 | 26,258 | 23,075 | 12 | 0 | 0 | 0 | 2 | 5 | 1 | 6 | 3 | 0 | 0 | 0 |
| 2013 | ALL | 45.3 | 46.0 | 13 | 73,009 | 51,250 | 6 | 0 | 0 | 0 | 1 | 3 | 5 | 2 | 2 | 0 | 0 | 0 |
| M. Johnston | ||||||||||||||||||
| YEAR | TYPE | MEAN RTG |
MEDN RTG |
TOT RTD |
SALE MEAN (£) |
SALE MEDN (£) |
BUY TOT |
< 1 | 1- 10 |
11- 20 |
21- 30 |
31- 40 |
41- 50 |
51- 60 |
61- 70 |
71- 80 |
81- 90 |
91- 100 |
| 1013 | ALL | 40.7 | 42.5 | 264 | 54,712 | 44,100 | 143 | 7 | 7 | 18 | 28 | 60 | 65 | 55 | 16 | 7 | 1 | 0 |
| 1013 | BUY | 41.6 | 45.0 | 143 | 54,712 | 44,100 | 143 | 7 | 5 | 4 | 8 | 31 | 44 | 32 | 8 | 4 | 0 | 0 |
| 2007 | ALL | 47.3 | 48.0 | 97 | 57,143 | 48,300 | 40 | 0 | 0 | 7 | 3 | 14 | 30 | 31 | 9 | 2 | 0 | 1 |
| 2010 | ALL | 41.3 | 45.0 | 60 | 62,406 | 55,272 | 37 | 1 | 1 | 3 | 8 | 10 | 20 | 15 | 2 | 0 | 0 | 0 |
| 2011 | ALL | 44.6 | 45.0 | 66 | 47,074 | 31,500 | 33 | 2 | 1 | 3 | 4 | 15 | 14 | 16 | 6 | 4 | 1 | 0 |
| 2012 | ALL | 39.3 | 41.0 | 57 | 58,496 | 57,750 | 31 | 3 | 2 | 2 | 7 | 14 | 12 | 13 | 2 | 2 | 0 | 0 |
| 2013 | ALL | 38.0 | 38.0 | 81 | 51,141 | 38,289 | 42 | 1 | 3 | 10 | 9 | 21 | 19 | 11 | 6 | 1 | 0 | 0 |
| S. Kirk | ||||||||||||||||||
| YEAR | TYPE | MEAN RTG |
MEDN RTG |
TOT RTD |
SALE MEAN (£) |
SALE MEDN (£) |
BUY TOT |
< 1 | 1- 10 |
11- 20 |
21- 30 |
31- 40 |
41- 50 |
51- 60 |
61- 70 |
71- 80 |
81- 90 |
91- 100 |
| 1013 | ALL | 32.8 | 35.0 | 72 | 17,262 | 13,605 | 50 | 2 | 3 | 10 | 16 | 14 | 20 | 6 | 1 | 0 | 0 | 0 |
| 1013 | BUY | 32.9 | 34.0 | 50 | 17,262 | 13,605 | 50 | 1 | 2 | 7 | 11 | 10 | 14 | 4 | 1 | 0 | 0 | 0 |
| 2007 | ALL | 42.7 | 41.0 | 25 | 30,680 | 24,150 | 15 | 0 | 0 | 2 | 4 | 5 | 7 | 4 | 2 | 0 | 1 | 0 |
| 2010 | ALL | 33.6 | 32.5 | 26 | 9,988 | 8,078 | 19 | 0 | 1 | 6 | 5 | 4 | 6 | 3 | 1 | 0 | 0 | 0 |
| 2011 | ALL | 35.5 | 41.0 | 21 | 15,115 | 12,600 | 14 | 1 | 0 | 1 | 5 | 3 | 9 | 2 | 0 | 0 | 0 | 0 |
| 2012 | ALL | 31.0 | 32.0 | 13 | 35,870 | 21,000 | 9 | 0 | 1 | 3 | 2 | 2 | 4 | 1 | 0 | 0 | 0 | 0 |
| 2013 | ALL | 28.3 | 31.5 | 12 | 17,363 | 17,450 | 8 | 1 | 1 | 0 | 4 | 5 | 1 | 0 | 0 | 0 | 0 | 0 |
| A. J. McCabe | ||||||||||||||||||
| YEAR | TYPE | MEAN RTG |
MEDN RTG |
TOT RTD |
SALE MEAN (£) |
SALE MEDN (£) |
BUY TOT |
< 1 | 1- 10 |
11- 20 |
21- 30 |
31- 40 |
41- 50 |
51- 60 |
61- 70 |
71- 80 |
81- 90 |
91- 100 |
| 1013 | ALL | 27.7 | 31.0 | 63 | 20,134 | 7,327 | 40 | 8 | 6 | 8 | 7 | 16 | 12 | 4 | 1 | 1 | 0 | 0 |
| 1013 | BUY | 34.8 | 37.5 | 40 | 20,134 | 7,327 | 40 | 2 | 3 | 3 | 4 | 12 | 11 | 4 | 0 | 1 | 0 | 0 |
| 2007 | ALL | 22.5 | 33.5 | 8 | 12,735 | 10,500 | 7 | 2 | 0 | 1 | 1 | 3 | 0 | 1 | 0 | 0 | 0 | 0 |
| 2010 | ALL | 33.9 | 34.0 | 22 | 7,925 | 6,650 | 14 | 1 | 2 | 1 | 3 | 7 | 5 | 2 | 1 | 0 | 0 | 0 |
| 2011 | ALL | 29.3 | 37.0 | 17 | 27,547 | 5,000 | 13 | 3 | 0 | 2 | 1 | 5 | 4 | 1 | 0 | 1 | 0 | 0 |
| 2012 | ALL | 22.8 | 20.0 | 13 | 33,049 | 15,000 | 7 | 1 | 2 | 4 | 2 | 2 | 1 | 1 | 0 | 0 | 0 | 0 |
| 2013 | ALL | 19.0 | 19.0 | 11 | 17,492 | 11,300 | 6 | 3 | 2 | 1 | 1 | 2 | 2 | 0 | 0 | 0 | 0 | 0 |
| E. S. McMahon | ||||||||||||||||||
| YEAR | TYPE | MEAN RTG |
MEDN RTG |
TOT RTD |
SALE MEAN (£) |
SALE MEDN (£) |
BUY TOT |
< 1 | 1- 10 |
11- 20 |
21- 30 |
31- 40 |
41- 50 |
51- 60 |
61- 70 |
71- 80 |
81- 90 |
91- 100 |
| 1013 | ALL | 45.1 | 45.5 | 54 | 20,544 | 19,500 | 37 | 0 | 0 | 4 | 6 | 10 | 15 | 8 | 8 | 2 | 1 | 0 |
| 1013 | BUY | 45.5 | 46.0 | 37 | 20,544 | 19,500 | 37 | 0 | 0 | 4 | 3 | 7 | 10 | 4 | 6 | 2 | 1 | 0 |
| 2007 | ALL | 46.0 | 45.0 | 13 | 19,077 | 19,055 | 10 | 0 | 0 | 0 | 2 | 3 | 4 | 1 | 3 | 0 | 0 | 0 |
| 2010 | ALL | 50.9 | 46.0 | 9 | 16,608 | 17,450 | 6 | 0 | 0 | 0 | 1 | 2 | 2 | 1 | 1 | 1 | 1 | 0 |
| 2011 | ALL | 48.8 | 49.5 | 18 | 23,541 | 21,000 | 15 | 0 | 0 | 1 | 1 | 3 | 6 | 2 | 4 | 1 | 0 | 0 |
| 2012 | ALL | 49.7 | 51.5 | 10 | 22,210 | 26,000 | 5 | 0 | 0 | 0 | 1 | 1 | 2 | 4 | 2 | 0 | 0 | 0 |
| 2013 | ALL | 35.3 | 38.0 | 17 | 17,845 | 13,000 | 11 | 0 | 0 | 3 | 3 | 4 | 5 | 1 | 1 | 0 | 0 | 0 |
| B. J. Meehan | ||||||||||||||||||
| YEAR | TYPE | MEAN RTG |
MEDN RTG |
TOT RTD |
SALE MEAN (£) |
SALE MEDN (£) |
BUY TOT |
< 1 | 1- 10 |
11- 20 |
21- 30 |
31- 40 |
41- 50 |
51- 60 |
61- 70 |
71- 80 |
81- 90 |
91- 100 |
| 1013 | ALL | 44.5 | 45.0 | 195 | 61,321 | 47,775 | 128 | 3 | 2 | 8 | 22 | 36 | 52 | 46 | 15 | 11 | 0 | 0 |
| 1013 | BUY | 48.0 | 47.5 | 128 | 61,321 | 47,775 | 128 | 2 | 0 | 5 | 7 | 16 | 42 | 33 | 13 | 10 | 0 | 0 |
| 2007 | ALL | 49.8 | 50.0 | 66 | 88,240 | 68,250 | 48 | 0 | 0 | 2 | 10 | 12 | 9 | 12 | 15 | 4 | 1 | 0 |
| 2010 | ALL | 45.3 | 45.0 | 63 | 66,850 | 54,600 | 40 | 1 | 1 | 4 | 7 | 11 | 15 | 11 | 7 | 6 | 0 | 0 |
| 2011 | ALL | 44.8 | 46.0 | 59 | 59,234 | 42,517 | 45 | 2 | 1 | 1 | 6 | 9 | 18 | 13 | 4 | 5 | 0 | 0 |
| 2012 | ALL | 45.0 | 46.0 | 44 | 51,997 | 45,493 | 26 | 0 | 0 | 1 | 6 | 5 | 14 | 16 | 2 | 0 | 0 | 0 |
| 2013 | ALL | 41.4 | 39.0 | 29 | 68,092 | 42,000 | 17 | 0 | 0 | 2 | 3 | 11 | 5 | 6 | 2 | 0 | 0 | 0 |
| B. R Millman | ||||||||||||||||||
| YEAR | TYPE | MEAN RTG |
MEDN RTG |
TOT RTD |
SALE MEAN (£) |
SALE MEDN (£) |
BUY TOT |
< 1 | 1- 10 |
11- 20 |
21- 30 |
31- 40 |
41- 50 |
51- 60 |
61- 70 |
71- 80 |
81- 90 |
91- 100 |
| 1013 | ALL | 35.7 | 39.5 | 46 | 11,996 | 9,354 | 33 | 4 | 1 | 3 | 6 | 11 | 11 | 8 | 2 | 0 | 0 | 0 |
| 1013 | BUY | 39.4 | 42.0 | 33 | 11,996 | 9,354 | 33 | 1 | 1 | 2 | 5 | 6 | 9 | 7 | 2 | 0 | 0 | 0 |
| 2007 | ALL | 33.3 | 31.0 | 17 | 16,099 | 16,800 | 13 | 0 | 1 | 3 | 5 | 3 | 2 | 2 | 1 | 0 | 0 | 0 |
| 2010 | ALL | 36.8 | 40.0 | 10 | 17,295 | 21,279 | 8 | 1 | 1 | 0 | 1 | 2 | 2 | 2 | 1 | 0 | 0 | 0 |
| 2011 | ALL | 42.2 | 41.5 | 14 | 6,577 | 5,250 | 11 | 0 | 0 | 1 | 1 | 3 | 6 | 2 | 1 | 0 | 0 | 0 |
| 2012 | ALL | 31.0 | 37.5 | 10 | 14,792 | 13,000 | 6 | 2 | 0 | 0 | 1 | 4 | 0 | 3 | 0 | 0 | 0 | 0 |
| 2013 | ALL | 31.0 | 30.5 | 12 | 12,050 | 10,452 | 8 | 1 | 0 | 2 | 3 | 2 | 3 | 1 | 0 | 0 | 0 | 0 |
| J. S. Moore | ||||||||||||||||||
| YEAR | TYPE | MEAN RTG |
MEDN RTG |
TOT RTD |
SALE MEAN (£) |
SALE MEDN (£) |
BUY TOT |
< 1 | 1- 10 |
11- 20 |
21- 30 |
31- 40 |
41- 50 |
51- 60 |
61- 70 |
71- 80 |
81- 90 |
91- 100 |
| 1013 | ALL | 33.5 | 34.0 | 105 | 8,226 | 5,102 | 77 | 7 | 0 | 12 | 21 | 29 | 23 | 9 | 4 | 0 | 0 | 0 |
| 1013 | BUY | 36.2 | 36.0 | 77 | 8,226 | 5,102 | 77 | 3 | 0 | 6 | 18 | 19 | 19 | 8 | 4 | 0 | 0 | 0 |
| 2007 | ALL | 41.3 | 41.0 | 27 | 21,020 | 14,456 | 23 | 0 | 3 | 1 | 2 | 6 | 7 | 2 | 4 | 2 | 0 | 0 |
| 2010 | ALL | 40.4 | 40.5 | 24 | 12,729 | 8,000 | 19 | 0 | 0 | 2 | 2 | 8 | 8 | 1 | 3 | 0 | 0 | 0 |
| 2011 | ALL | 38.7 | 41.0 | 23 | 8,014 | 5,051 | 20 | 1 | 0 | 2 | 3 | 5 | 5 | 6 | 1 | 0 | 0 | 0 |
| 2012 | ALL | 27.4 | 29.0 | 25 | 7,599 | 6,973 | 13 | 2 | 0 | 4 | 7 | 10 | 2 | 0 | 0 | 0 | 0 | 0 |
| 2013 | ALL | 29.5 | 30.0 | 33 | 5,299 | 4,200 | 25 | 4 | 0 | 4 | 9 | 6 | 8 | 2 | 0 | 0 | 0 | 0 |
| H. Morrison | ||||||||||||||||||
| YEAR | TYPE | MEAN RTG |
MEDN RTG |
TOT RTD |
SALE MEAN (£) |
SALE MEDN (£) |
BUY TOT |
< 1 | 1- 10 |
11- 20 |
21- 30 |
31- 40 |
41- 50 |
51- 60 |
61- 70 |
71- 80 |
81- 90 |
91- 100 |
| 1013 | ALL | 36.1 | 35.5 | 56 | 36,817 | 31,500 | 36 | 1 | 3 | 9 | 7 | 12 | 15 | 5 | 4 | 0 | 0 | 0 |
| 1013 | BUY | 38.9 | 40.5 | 36 | 36,817 | 31,500 | 36 | 0 | 2 | 5 | 6 | 5 | 10 | 4 | 4 | 0 | 0 | 0 |
| 2007 | ALL | 35.3 | 36.0 | 12 | 49,525 | 35,175 | 6 | 1 | 0 | 1 | 3 | 4 | 1 | 1 | 0 | 0 | 1 | 0 |
| 2010 | ALL | 45.5 | 43.5 | 14 | 46,568 | 31,500 | 9 | 0 | 0 | 0 | 1 | 3 | 7 | 1 | 2 | 0 | 0 | 0 |
| 2011 | ALL | 35.4 | 36.0 | 18 | 30,258 | 31,500 | 12 | 0 | 1 | 6 | 1 | 3 | 2 | 3 | 2 | 0 | 0 | 0 |
| 2012 | ALL | 36.6 | 37.0 | 10 | 32,156 | 24,150 | 8 | 0 | 1 | 0 | 3 | 1 | 4 | 1 | 0 | 0 | 0 | 0 |
| 2013 | ALL | 27.3 | 30.5 | 14 | 40,852 | 31,500 | 7 | 1 | 1 | 3 | 2 | 5 | 2 | 0 | 0 | 0 | 0 | 0 |
| W. R. Muir | ||||||||||||||||||
| YEAR | TYPE | MEAN RTG |
MEDN RTG |
TOT RTD |
SALE MEAN (£) |
SALE MEDN (£) |
BUY TOT |
< 1 | 1- 10 |
11- 20 |
21- 30 |
31- 40 |
41- 50 |
51- 60 |
61- 70 |
71- 80 |
81- 90 |
91- 100 |
| 1013 | ALL | 38.0 | 38.0 | 47 | 30,746 | 26,250 | 31 | 1 | 1 | 3 | 7 | 17 | 9 | 5 | 3 | 1 | 0 | 0 |
| 1013 | BUY | 43.3 | 42.0 | 31 | 30,746 | 26,250 | 31 | 0 | 0 | 1 | 3 | 11 | 8 | 4 | 3 | 1 | 0 | 0 |
| 2007 | ALL | 44.8 | 46.0 | 16 | 26,572 | 21,000 | 13 | 0 | 0 | 0 | 3 | 1 | 7 | 5 | 0 | 0 | 0 | 0 |
| 2010 | ALL | 38.0 | 37.0 | 9 | 23,736 | 16,800 | 7 | 0 | 0 | 0 | 0 | 7 | 1 | 1 | 0 | 0 | 0 | 0 |
| 2011 | ALL | 43.4 | 41.0 | 18 | 27,169 | 26,250 | 13 | 0 | 0 | 1 | 3 | 5 | 3 | 3 | 3 | 0 | 0 | 0 |
| 2012 | ALL | 42.3 | 49.0 | 7 | 41,917 | 45,000 | 5 | 0 | 0 | 1 | 2 | 0 | 2 | 1 | 0 | 1 | 0 | 0 |
| 2013 | ALL | 28.3 | 32.0 | 13 | 37,367 | 33,600 | 6 | 1 | 1 | 1 | 2 | 5 | 3 | 0 | 0 | 0 | 0 | 0 |
| A. P. O'Brien | ||||||||||||||||||
| YEAR | TYPE | MEAN RTG |
MEDN RTG |
TOT RTD |
SALE MEAN (£) |
SALE MEDN (£) |
BUY TOT |
< 1 | 1- 10 |
11- 20 |
21- 30 |
31- 40 |
41- 50 |
51- 60 |
61- 70 |
71- 80 |
81- 90 |
91- 100 |
| 1013 | BUY | 64.7 | 64.0 | 6 | 414,799 | 378,000 | 6 | 0 | 0 | 0 | 0 | 0 | 0 | 2 | 3 | 1 | 0 | 0 |
| 1013 | ALL | 70.8 | 64.0 | 18 | 414,799 | 378,000 | 6 | 0 | 0 | 0 | 0 | 0 | 0 | 3 | 6 | 6 | 3 | 0 |
| 2007 | ALL | 71.0 | 71.0 | 2 | 520,156 | 520,156 | 1 | 0 | 0 | 0 | 0 | 0 | 0 | 1 | 0 | 0 | 1 | 0 |
| 2011 | ALL | 70.0 | 70.0 | 2 | 0, | 0, | 0 | 0 | 0 | 0 | 0 | 0 | 0 | 0 | 1 | 1 | 0 | 0 |
| 2012 | ALL | 0.0 | 0.0 | 4 | 0, | 0, | 0 | 4 | 0 | 0 | 0 | 0 | 0 | 0 | 0 | 0 | 0 | 0 |
| 2013 | ALL | 66.0 | 64.0 | 9 | 414,799 | 378,000 | 6 | 0 | 0 | 0 | 0 | 0 | 0 | 2 | 5 | 1 | 1 | 0 |
| D. O'Meara | ||||||||||||||||||
| YEAR | TYPE | MEAN RTG |
MEDN RTG |
TOT RTD |
SALE MEAN (£) |
SALE MEDN (£) |
BUY TOT |
< 1 | 1- 10 |
11- 20 |
21- 30 |
31- 40 |
41- 50 |
51- 60 |
61- 70 |
71- 80 |
81- 90 |
91- 100 |
| 1013 | ALL | 30.3 | 34.0 | 47 | 8,715 | 7,000 | 29 | 2 | 4 | 5 | 11 | 8 | 13 | 4 | 0 | 0 | 0 | 0 |
| 1013 | BUY | 37.2 | 39.0 | 29 | 8,715 | 7,000 | 29 | 0 | 0 | 1 | 9 | 6 | 10 | 3 | 0 | 0 | 0 | 0 |
| 2010 | ALL | 26.8 | 22.0 | 8 | 2,551 | 2,338 | 4 | 0 | 2 | 2 | 1 | 0 | 2 | 1 | 0 | 0 | 0 | 0 |
| 2011 | ALL | 25.4 | 27.0 | 9 | 3,668 | 3,401 | 6 | 1 | 0 | 0 | 5 | 1 | 0 | 2 | 0 | 0 | 0 | 0 |
| 2012 | ALL | 35.9 | 39.5 | 12 | 9,529 | 9,177 | 10 | 0 | 0 | 2 | 2 | 3 | 5 | 0 | 0 | 0 | 0 | 0 |
| 2013 | ALL | 30.6 | 34.5 | 18 | 13,915 | 12,000 | 9 | 1 | 2 | 1 | 3 | 4 | 6 | 1 | 0 | 0 | 0 | 0 |
| M. Prescott | ||||||||||||||||||
| YEAR | TYPE | MEAN RTG |
MEDN RTG |
TOT RTD |
SALE MEAN (£) |
SALE MEDN (£) |
BUY TOT |
< 1 | 1- 10 |
11- 20 |
21- 30 |
31- 40 |
41- 50 |
51- 60 |
61- 70 |
71- 80 |
81- 90 |
91- 100 |
| 1013 | ALL | 36.0 | 37.0 | 76 | 62,865 | 49,135 | 26 | 3 | 4 | 11 | 13 | 13 | 12 | 8 | 9 | 2 | 1 | 0 |
| 1013 | BUY | 38.0 | 37.5 | 26 | 62,865 | 49,135 | 26 | 1 | 1 | 4 | 5 | 4 | 3 | 3 | 3 | 2 | 0 | 0 |
| 2007 | ALL | 33.3 | 34.0 | 24 | 85,557 | 91,919 | 10 | 1 | 2 | 2 | 6 | 6 | 4 | 1 | 1 | 1 | 0 | 0 |
| 2010 | ALL | 45.2 | 38.5 | 20 | 44,365 | 42,000 | 9 | 0 | 1 | 1 | 2 | 7 | 2 | 2 | 3 | 1 | 1 | 0 |
| 2011 | ALL | 41.6 | 46.0 | 19 | 90,272 | 78,750 | 7 | 1 | 1 | 1 | 2 | 2 | 5 | 3 | 3 | 1 | 0 | 0 |
| 2012 | ALL | 28.9 | 28.0 | 21 | 56,957 | 31,007 | 4 | 1 | 1 | 5 | 5 | 4 | 2 | 0 | 3 | 0 | 0 | 0 |
| 2013 | ALL | 27.1 | 24.0 | 16 | 62,581 | 57,010 | 6 | 1 | 1 | 4 | 4 | 0 | 3 | 3 | 0 | 0 | 0 | 0 |
| J. J. Quinn | ||||||||||||||||||
| YEAR | TYPE | MEAN RTG |
MEDN RTG |
TOT RTD |
SALE MEAN (£) |
SALE MEDN (£) |
BUY TOT |
< 1 | 1- 10 |
11- 20 |
21- 30 |
31- 40 |
41- 50 |
51- 60 |
61- 70 |
71- 80 |
81- 90 |
91- 100 |
| 1013 | ALL | 33.5 | 34.5 | 56 | 22,260 | 16,000 | 37 | 3 | 1 | 4 | 13 | 17 | 12 | 4 | 0 | 2 | 0 | 0 |
| 1013 | BUY | 35.1 | 37.0 | 37 | 22,260 | 16,000 | 37 | 2 | 1 | 4 | 6 | 8 | 11 | 3 | 0 | 2 | 0 | 0 |
| 2007 | ALL | 26.5 | 34.5 | 16 | 14,273 | 11,054 | 8 | 3 | 1 | 1 | 2 | 5 | 2 | 2 | 0 | 0 | 0 | 0 |
| 2010 | ALL | 35.5 | 34.0 | 11 | 16,975 | 18,000 | 8 | 0 | 0 | 1 | 3 | 5 | 1 | 0 | 0 | 1 | 0 | 0 |
| 2011 | ALL | 34.5 | 33.0 | 13 | 28,208 | 14,354 | 8 | 1 | 0 | 1 | 4 | 2 | 4 | 0 | 0 | 1 | 0 | 0 |
| 2012 | ALL | 37.3 | 37.5 | 10 | 18,681 | 18,000 | 7 | 0 | 1 | 1 | 0 | 4 | 1 | 3 | 0 | 0 | 0 | 0 |
| 2013 | ALL | 30.3 | 33.0 | 22 | 23,670 | 13,803 | 14 | 2 | 0 | 1 | 6 | 6 | 6 | 1 | 0 | 0 | 0 | 0 |
| K. A. Ryan | ||||||||||||||||||
| YEAR | TYPE | MEAN RTG |
MEDN RTG |
TOT RTD |
SALE MEAN (£) |
SALE MEDN (£) |
BUY TOT |
< 1 | 1- 10 |
11- 20 |
21- 30 |
31- 40 |
41- 50 |
51- 60 |
61- 70 |
71- 80 |
81- 90 |
91- 100 |
| 1013 | ALL | 42.6 | 43.0 | 188 | 31,216 | 25,510 | 136 | 3 | 4 | 10 | 25 | 37 | 44 | 39 | 17 | 9 | 0 | 0 |
| 1013 | BUY | 45.4 | 46.0 | 136 | 31,216 | 25,510 | 136 | 1 | 2 | 3 | 18 | 27 | 31 | 30 | 15 | 9 | 0 | 0 |
| 2007 | ALL | 45.0 | 45.0 | 59 | 55,833 | 41,242 | 42 | 2 | 0 | 2 | 8 | 10 | 14 | 9 | 11 | 3 | 0 | 0 |
| 2010 | ALL | 41.8 | 43.0 | 41 | 25,194 | 23,100 | 31 | 1 | 2 | 2 | 3 | 10 | 8 | 11 | 2 | 2 | 0 | 0 |
| 2011 | ALL | 45.4 | 49.0 | 52 | 24,933 | 25,100 | 36 | 2 | 0 | 3 | 6 | 8 | 8 | 13 | 10 | 2 | 0 | 0 |
| 2012 | ALL | 40.4 | 41.0 | 52 | 40,271 | 25,935 | 36 | 0 | 2 | 1 | 11 | 10 | 15 | 9 | 2 | 2 | 0 | 0 |
| 2013 | ALL | 42.8 | 42.0 | 43 | 33,850 | 26,250 | 33 | 0 | 0 | 4 | 5 | 9 | 13 | 6 | 3 | 3 | 0 | 0 |
| D. M. Simcock | ||||||||||||||||||
| YEAR | TYPE | MEAN RTG |
MEDN RTG |
TOT RTD |
SALE MEAN (£) |
SALE MEDN (£) |
BUY TOT |
< 1 | 1- 10 |
11- 20 |
21- 30 |
31- 40 |
41- 50 |
51- 60 |
61- 70 |
71- 80 |
81- 90 |
91- 100 |
| 1013 | ALL | 44.6 | 45.0 | 63 | 46,103 | 35,325 | 44 | 1 | 1 | 3 | 4 | 11 | 21 | 14 | 6 | 1 | 0 | 1 |
| 1013 | BUY | 47.0 | 45.5 | 44 | 46,103 | 35,325 | 44 | 0 | 0 | 3 | 1 | 8 | 15 | 9 | 6 | 1 | 0 | 1 |
| 2007 | ALL | 43.9 | 41.5 | 10 | 50,854 | 45,291 | 8 | 0 | 0 | 0 | 2 | 3 | 2 | 2 | 1 | 0 | 0 | 0 |
| 2010 | ALL | 46.8 | 46.0 | 14 | 36,089 | 34,800 | 12 | 0 | 0 | 2 | 0 | 1 | 7 | 2 | 1 | 0 | 0 | 1 |
| 2011 | ALL | 45.7 | 44.0 | 21 | 41,928 | 34,650 | 15 | 0 | 0 | 0 | 2 | 5 | 6 | 5 | 3 | 0 | 0 | 0 |
| 2012 | ALL | 46.0 | 45.0 | 17 | 51,405 | 30,450 | 11 | 0 | 0 | 1 | 1 | 4 | 5 | 4 | 1 | 1 | 0 | 0 |
| 2013 | ALL | 37.6 | 42.0 | 11 | 66,850 | 57,750 | 6 | 1 | 1 | 0 | 1 | 1 | 3 | 3 | 1 | 0 | 0 | 0 |
| B. Smart | ||||||||||||||||||
| YEAR | TYPE | MEAN RTG |
MEDN RTG |
TOT RTD |
SALE MEAN (£) |
SALE MEDN (£) |
BUY TOT |
< 1 | 1- 10 |
11- 20 |
21- 30 |
31- 40 |
41- 50 |
51- 60 |
61- 70 |
71- 80 |
81- 90 |
91- 100 |
| 1013 | ALL | 38.3 | 40.0 | 77 | 22,802 | 18,900 | 53 | 4 | 2 | 6 | 13 | 16 | 15 | 12 | 7 | 2 | 0 | 0 |
| 1013 | BUY | 40.9 | 43.0 | 53 | 22,802 | 18,900 | 53 | 2 | 1 | 6 | 6 | 9 | 11 | 9 | 7 | 2 | 0 | 0 |
| 2007 | ALL | 46.9 | 46.0 | 31 | 29,197 | 26,250 | 25 | 0 | 1 | 2 | 2 | 6 | 9 | 4 | 3 | 3 | 1 | 0 |
| 2010 | ALL | 41.3 | 46.0 | 18 | 17,842 | 16,750 | 12 | 0 | 1 | 2 | 4 | 1 | 2 | 3 | 4 | 1 | 0 | 0 |
| 2011 | ALL | 40.1 | 40.0 | 29 | 28,038 | 21,000 | 23 | 2 | 0 | 2 | 4 | 8 | 4 | 5 | 3 | 1 | 0 | 0 |
| 2012 | ALL | 36.8 | 39.0 | 15 | 29,678 | 25,000 | 9 | 0 | 1 | 1 | 2 | 4 | 5 | 2 | 0 | 0 | 0 | 0 |
| 2013 | ALL | 32.6 | 36.0 | 15 | 9,156 | 10,000 | 9 | 2 | 0 | 1 | 3 | 3 | 4 | 2 | 0 | 0 | 0 | 0 |
| O. Stevens | ||||||||||||||||||
| YEAR | TYPE | MEAN RTG |
MEDN RTG |
TOT RTD |
SALE MEAN (£) |
SALE MEDN (£) |
BUY TOT |
< 1 | 1- 10 |
11- 20 |
21- 30 |
31- 40 |
41- 50 |
51- 60 |
61- 70 |
71- 80 |
81- 90 |
91- 100 |
| 1013 | ALL | 45.2 | 45.0 | 17 | 36,755 | 18,500 | 12 | 0 | 0 | 1 | 4 | 2 | 3 | 3 | 2 | 2 | 0 | 0 |
| 1013 | BUY | 47.3 | 47.0 | 12 | 36,755 | 18,500 | 12 | 0 | 0 | 1 | 2 | 2 | 2 | 1 | 2 | 2 | 0 | 0 |
| 2013 | ALL | 45.2 | 45.0 | 17 | 36,755 | 18,500 | 12 | 0 | 0 | 1 | 4 | 2 | 3 | 3 | 2 | 2 | 0 | 0 |
| M. Stoute | ||||||||||||||||||
| YEAR | TYPE | MEAN RTG |
MEDN RTG |
TOT RTD |
SALE MEAN (£) |
SALE MEDN (£) |
BUY TOT |
< 1 | 1- 10 |
11- 20 |
21- 30 |
31- 40 |
41- 50 |
51- 60 |
61- 70 |
71- 80 |
81- 90 |
91- 100 |
| 1013 | ALL | 46.7 | 46.5 | 88 | 197,050 | 187,075 | 21 | 0 | 1 | 2 | 5 | 20 | 33 | 12 | 10 | 5 | 0 | 0 |
| 1013 | BUY | 48.2 | 49.0 | 21 | 197,050 | 187,075 | 21 | 0 | 0 | 1 | 1 | 1 | 11 | 3 | 3 | 1 | 0 | 0 |
| 2007 | ALL | 55.2 | 54.0 | 33 | 247,114 | 210,000 | 7 | 0 | 0 | 0 | 0 | 4 | 9 | 9 | 8 | 2 | 1 | 0 |
| 2010 | ALL | 48.2 | 47.0 | 25 | 256,200 | 241,500 | 5 | 0 | 1 | 0 | 0 | 7 | 9 | 2 | 3 | 3 | 0 | 0 |
| 2011 | ALL | 48.5 | 50.0 | 28 | 217,659 | 195,059 | 9 | 0 | 0 | 1 | 3 | 4 | 8 | 4 | 6 | 2 | 0 | 0 |
| 2012 | ALL | 44.9 | 45.0 | 15 | 124,127 | 93,537 | 5 | 0 | 0 | 0 | 1 | 2 | 9 | 3 | 0 | 0 | 0 | 0 |
| 2013 | ALL | 43.7 | 42.0 | 20 | 138,739 | 138,739 | 2 | 0 | 0 | 1 | 1 | 7 | 7 | 3 | 1 | 0 | 0 | 0 |
| S. B. Suroor | ||||||||||||||||||
| YEAR | TYPE | MEAN RTG |
MEDN RTG |
TOT RTD |
SALE MEAN (£) |
SALE MEDN (£) |
BUY TOT |
< 1 | 1- 10 |
11- 20 |
21- 30 |
31- 40 |
41- 50 |
51- 60 |
61- 70 |
71- 80 |
81- 90 |
91- 100 |
| 1013 | ALL | 52.7 | 53.0 | 127 | 158,487 | 126,000 | 40 | 0 | 0 | 1 | 6 | 12 | 31 | 40 | 29 | 7 | 1 | 0 |
| 1013 | BUY | 56.1 | 59.0 | 40 | 158,487 | 126,000 | 40 | 0 | 0 | 0 | 1 | 3 | 7 | 13 | 14 | 2 | 0 | 0 |
| 2007 | ALL | 60.8 | 54.0 | 17 | 470,044 | 390,117 | 6 | 0 | 0 | 0 | 0 | 1 | 6 | 4 | 0 | 4 | 0 | 2 |
| 2010 | ALL | 57.1 | 56.0 | 31 | 217,697 | 157,500 | 9 | 0 | 0 | 0 | 1 | 1 | 5 | 12 | 8 | 3 | 1 | 0 |
| 2011 | ALL | 50.8 | 53.0 | 27 | 133,989 | 104,031 | 11 | 0 | 0 | 0 | 4 | 1 | 6 | 9 | 7 | 0 | 0 | 0 |
| 2012 | ALL | 50.0 | 51.0 | 22 | 139,189 | 107,144 | 6 | 0 | 0 | 0 | 0 | 4 | 7 | 7 | 4 | 0 | 0 | 0 |
| 2013 | ALL | 52.3 | 53.0 | 47 | 147,941 | 118,125 | 14 | 0 | 0 | 1 | 1 | 6 | 13 | 12 | 10 | 4 | 0 | 0 |
| J. J. S. Tate | ||||||||||||||||||
| YEAR | TYPE | MEAN RTG |
MEDN RTG |
TOT RTD |
SALE MEAN (£) |
SALE MEDN (£) |
BUY TOT |
< 1 | 1- 10 |
11- 20 |
21- 30 |
31- 40 |
41- 50 |
51- 60 |
61- 70 |
71- 80 |
81- 90 |
91- 100 |
| 1013 | ALL | 45.4 | 45.0 | 43 | 40,897 | 38,000 | 31 | 0 | 0 | 0 | 3 | 14 | 9 | 13 | 4 | 0 | 0 | 0 |
| 1013 | BUY | 47.6 | 50.0 | 31 | 40,897 | 38,000 | 31 | 0 | 0 | 0 | 1 | 9 | 6 | 11 | 4 | 0 | 0 | 0 |
| 2012 | ALL | 46.2 | 45.0 | 17 | 40,265 | 32,550 | 12 | 0 | 0 | 0 | 1 | 5 | 5 | 4 | 2 | 0 | 0 | 0 |
| 2013 | ALL | 44.9 | 43.0 | 26 | 41,296 | 40,000 | 19 | 0 | 0 | 0 | 2 | 9 | 4 | 9 | 2 | 0 | 0 | 0 |
| N. Tinkler | ||||||||||||||||||
| YEAR | TYPE | MEAN RTG |
MEDN RTG |
TOT RTD |
SALE MEAN (£) |
SALE MEDN (£) |
BUY TOT |
< 1 | 1- 10 |
11- 20 |
21- 30 |
31- 40 |
41- 50 |
51- 60 |
61- 70 |
71- 80 |
81- 90 |
91- 100 |
| 1013 | ALL | 24.0 | 24.5 | 42 | 15,243 | 8,000 | 32 | 5 | 3 | 10 | 8 | 9 | 5 | 2 | 0 | 0 | 0 | 0 |
| 1013 | BUY | 25.4 | 28.5 | 32 | 15,243 | 8,000 | 32 | 4 | 2 | 7 | 5 | 8 | 4 | 2 | 0 | 0 | 0 | 0 |
| 2007 | ALL | 22.2 | 24.0 | 12 | 15,469 | 13,125 | 10 | 1 | 1 | 3 | 2 | 3 | 2 | 0 | 0 | 0 | 0 | 0 |
| 2010 | ALL | 27.6 | 28.5 | 8 | 13,024 | 7,350 | 5 | 1 | 0 | 2 | 2 | 0 | 3 | 0 | 0 | 0 | 0 | 0 |
| 2011 | ALL | 30.3 | 33.0 | 9 | 12,576 | 8,252 | 8 | 1 | 2 | 0 | 0 | 3 | 1 | 2 | 0 | 0 | 0 | 0 |
| 2012 | ALL | 23.1 | 26.0 | 10 | 15,488 | 8,901 | 8 | 1 | 0 | 3 | 3 | 2 | 1 | 0 | 0 | 0 | 0 | 0 |
| 2013 | ALL | 18.7 | 20.0 | 15 | 18,013 | 7,000 | 11 | 2 | 1 | 5 | 3 | 4 | 0 | 0 | 0 | 0 | 0 | 0 |
| W. G. M. Turner | ||||||||||||||||||
| YEAR | TYPE | MEAN RTG |
MEDN RTG |
TOT RTD |
SALE MEAN (£) |
SALE MEDN (£) |
BUY TOT |
< 1 | 1- 10 |
11- 20 |
21- 30 |
31- 40 |
41- 50 |
51- 60 |
61- 70 |
71- 80 |
81- 90 |
91- 100 |
| 1013 | ALL | 29.8 | 30.0 | 44 | 7,588 | 9,500 | 13 | 3 | 3 | 5 | 11 | 5 | 9 | 8 | 0 | 0 | 0 | 0 |
| 1013 | BUY | 33.3 | 38.0 | 13 | 7,588 | 9,500 | 13 | 0 | 2 | 1 | 3 | 2 | 3 | 2 | 0 | 0 | 0 | 0 |
| 2007 | ALL | 28.0 | 26.0 | 15 | 5,256 | 4,200 | 11 | 0 | 1 | 6 | 1 | 4 | 2 | 1 | 0 | 0 | 0 | 0 |
| 2010 | ALL | 30.1 | 42.0 | 8 | 2,083 | 2,100 | 3 | 1 | 0 | 0 | 1 | 1 | 5 | 0 | 0 | 0 | 0 | 0 |
| 2011 | ALL | 29.2 | 25.0 | 11 | 12,600 | 12,600 | 1 | 0 | 1 | 1 | 5 | 1 | 1 | 2 | 0 | 0 | 0 | 0 |
| 2012 | ALL | 35.9 | 40.5 | 12 | 9,400 | 10,500 | 5 | 1 | 1 | 1 | 0 | 3 | 3 | 3 | 0 | 0 | 0 | 0 |
| 2013 | ALL | 24.5 | 23.0 | 13 | 8,200 | 6,500 | 4 | 1 | 1 | 3 | 5 | 0 | 0 | 3 | 0 | 0 | 0 | 0 |
| Roger Varian | ||||||||||||||||||
| YEAR | TYPE | MEAN RTG |
MEDN RTG |
TOT RTD |
SALE MEAN (£) |
SALE MEDN (£) |
BUY TOT |
< 1 | 1- 10 |
11- 20 |
21- 30 |
31- 40 |
41- 50 |
51- 60 |
61- 70 |
71- 80 |
81- 90 |
91- 100 |
| 1013 | ALL | 48.0 | 45.0 | 65 | 119,322 | 105,000 | 26 | 0 | 0 | 0 | 3 | 18 | 20 | 12 | 8 | 4 | 0 | 0 |
| 1013 | BUY | 50.9 | 49.5 | 26 | 119,322 | 105,000 | 26 | 0 | 0 | 0 | 0 | 10 | 3 | 6 | 4 | 3 | 0 | 0 |
| 2011 | ALL | 52.3 | 53.0 | 18 | 106,470 | 52,500 | 5 | 0 | 0 | 0 | 1 | 3 | 4 | 6 | 3 | 1 | 0 | 0 |
| 2012 | ALL | 47.5 | 45.0 | 26 | 117,615 | 103,520 | 10 | 0 | 0 | 0 | 1 | 6 | 11 | 3 | 4 | 1 | 0 | 0 |
| 2013 | ALL | 45.0 | 41.0 | 21 | 126,716 | 120,000 | 11 | 0 | 0 | 0 | 1 | 9 | 5 | 3 | 1 | 2 | 0 | 0 |
| Ed Walker | ||||||||||||||||||
| YEAR | TYPE | MEAN RTG |
MEDN RTG |
TOT RTD |
SALE MEAN (£) |
SALE MEDN (£) |
BUY TOT |
< 1 | 1- 10 |
11- 20 |
21- 30 |
31- 40 |
41- 50 |
51- 60 |
61- 70 |
71- 80 |
81- 90 |
91- 100 |
| 1013 | ALL | 42.6 | 50.0 | 19 | 53,594 | 42,000 | 16 | 1 | 0 | 2 | 0 | 3 | 4 | 6 | 2 | 1 | 0 | 0 |
| 1013 | BUY | 47.5 | 52.0 | 16 | 53,594 | 42,000 | 16 | 0 | 0 | 2 | 0 | 2 | 3 | 6 | 2 | 1 | 0 | 0 |
| 2011 | ALL | 45.5 | 48.0 | 4 | 24,970 | 32,510 | 3 | 0 | 0 | 0 | 0 | 1 | 1 | 2 | 0 | 0 | 0 | 0 |
| 2012 | ALL | 59.0 | 56.0 | 3 | 28,000 | 26,250 | 3 | 0 | 0 | 0 | 0 | 0 | 1 | 1 | 0 | 1 | 0 | 0 |
| 2013 | ALL | 37.5 | 42.5 | 12 | 69,860 | 51,375 | 10 | 1 | 0 | 2 | 0 | 2 | 2 | 3 | 2 | 0 | 0 | 0 |