 |
|
|
B2yoR grew out of on-course Paddock Review of 2yos but has developed into other areas to model and understand the workings of juvenile racing. Over a period dissatisfaction with the existing ratings available grew as it became clear that they could not be used as the basis to ask some important questions about 2yo races and performances. Even relatively simple, but important enquiries, such as 'What is the average rating achieved by a trainer's 2yos on debut?' would be obscured by the methods used to produce the ratings. Follow on questions such as 'How much do the 2yos improve from debut to second run?' are unanswerable because the starting point is unsafe.
Which is the origin of the B2yoR ratings which are termed [Estimates] which are found on this site. These ratings have always been an ongoing development project to try different approaches and methods to see what works and discard those that do not. The B2yoR Estimates are not tied to a set agenda and audience in the way that the Official Ratings (OR, produced by the British Horseracing Authority (BHA) handicappers) are and can afford to 'fail' in the attempt to improve. The fact that any approach needs to be given at least one season's worth of results to be trialled on means that development is a year to year undertaking.
This article covers the reworking of the 2007 B2yoR estimates and the results of that review. That work has produced a base set of data which will provide the model for the Estimates from now on and anyone using the website needs some understanding of the rating levels and how they relate to the OR figures. There are also more general discussions of related topics in the sections below to give those interested some further background.
The BHA handicap for racehorses on the flat works on a scale of 0-140 points. The '140' comes from the fact that 10 stones in the Imperial Measures system is 14x10 pounds (lbs). In a typical handicap the weights range from 10 stone downwards so there is a nested reference to the typical handicap in the 140 top rating. If you could bring together all of the Derby winners for the last 50 years and run them in a handicap the best of them (like Shergar) would be around the 140 mark and would get 10 stones to carry in this 'Derby Handicap'. A high class Derby winner like Grundy would be getting 6-7lbs and a lesser one like Henbit more than a stone. In the system one rating point equals one pound because that is the unit for weight carried in the race. At different distances one length beaten by would considered to equate to between 1-3lbs of lesser performance.
Horses that can rate 120+ are pretty rare and when you go racing you are more likely to be looking at horses in the 50-85 range. On the all-weather during the winter you might be drooling at the thought of a horse rated as high as 70 turning up (i.e. would receive 70lbs from Shergar in the all-time handicap). If you Paddock Review horses looking at handicaps that bring together horses in a narrow range of abilities, say 65-75, is very useful because you can see what physical types make that grade. If you look at a field of 85-95 handicappers they will be a noticeably different stamp of athlete to that 65-75 group even to the unpractised eye.
The juvenile handicap develops from the start of the season with the BHA's 2yo handicapper building up a set of ratings to cover each horse. His target is to be able to frame a handicap race, a 'Nursery', for those that have run often enough to demonstrate their ability by early July. The point has to be made strongly here that the public nature of the ratings and the fact they will be used for real races means the handicapper cannot experiment.
The pool of horses each year have a roughly similar distribution of ability and the thoroughbred has a relatively narrow range of overall performance (most will fit between 45-85 in that 0-140 scale). Which means the Official handicapper can make assumptions based on what a usual set of horses running in particular races each year should be capable of and will land his ratings on that narrow point - regardless of the actual ability shown in that race. B2yoR used to think that was a failing by the handicapper but it is actually the only sensible approach if your target is to produce a public handicap.
The handicapper has to assume all races are run up to a typical standard range because otherwise the risk is that there will be under-rated horses in your later races. They also have to be literal in assessing the distances that horses are beaten by. If a race is run at a slow pace and doesn't stretch the horses out properly the handicapper cannot take much of that into account. If you horse finishes within 2 lengths of the 80 rated winner over 5f he's going to get rated 74-5 no matter how poor the performance actually was. (We could all finish within 5 yards of Michael Johnson over 200 metres if he walked the first 190 of them but that wouldn't make us 130 class athletes.)
The problem then is that actual performance and ability can be masked and the assumptions lead to ratings which will not answer the questions mentioned above. The majority of other ratings producers follow the same approach and but with minor variations in the 1-5lbs range. This leads to a large percentage of 2yos being over-rated and their true ability blurred. TV pundits will then refer to the inflated ratings for unproven horses as if they were absolutely correct. This rolls on into various issues, for instance people getting upset when the 80 rated odds-on favourite gets beaten. There's a good chance he never ran above 60 in any previous race, is actually a '68' horse and by the time he's 4yo and competing solidly at that level as much will be clear. He may even get labelled with the 'failed to train on' tag because he was once an 80 horse. But he never was.
1.2 Internal WFA of the 2yo Season
One of the biggest problems with the current Official Ratings is the over-rating of early season form and how that leaves runners lacking scope to develop with inflated handicap marks later in the season. There is an unacknowledged 'Weight-For Age (WFA)" scale for the 2yos which the handicapper is unable to take account of.
Consider that the average horse is still growing and developing through to around 4yo at least. The bones in a horse stop growing, pretty much in time order, from the ground up from around 2 years through to 3 years and perhaps even into 4yo+ with the bones in the back. Part of the reason why young horses can look a bit 'leggy' because the long bones in the leg complete their growing phase first. The late 'setting' of the back and pelvis will mean that you will get a very good argument from some people that horses shouldn't be ridden before they are 4yo. There are also veterinary reports that active exercise and early stressing can encourage the formation of stronger bones, joints & muscles. In the NH world it's like the Store Horse vs French 3yo Chaser debate.
Whatever the precise merits in that prove to be the fact is that a 2yo running against 3yos will receive a standard amount of weight from them because of their lack of relative physical development. A '75' juvenile would receive something around 20-25 points (lbs) from a '75' rated 3yo if they were put in the same conditions race over 5f in later season. When Kingsgate Native won the Nunthorpe he received 22lbs from the 3yo males and 24lbs from the 4yos+. The 2lbs difference between 3yos & older horses is the tail end of a WFA allowance for their lack of development. This would have been around at 9lbs in January and would go down to zero in November over 5f indicating they were now considered the finished, mature horse. Remembering that these WFA allowances are for the average horse and like people you get precocious growers and late developers either side of the average.
There isn't a WFA scale within a group of
horses of the same age, this is what the relative handicap on the 0-140
scale which develops for 2yos through the season is for. Nurseries will
then use this scale on the basis that the abilities of the 2yos in comparison
to their own age group has been well enough demonstrated. 3yos make an
average 9lbs improvement from January 1st through to November and the handicapper
has had more chance to see them run in most cases and closer to the finished
athletic article. If a 2yo ever ran against a 4yo (a complete, mature horse)
in late April the WFA scale says they should receive around 28 lbs. By
August and the Nunthorpe that is down to 24lbs (Timeform would use 17lbs
by comparison) and 10lbs by the end of the year. So an average 2yo over
5f needs to make 18 rating points (lbs) improvement to stay in the same place in the
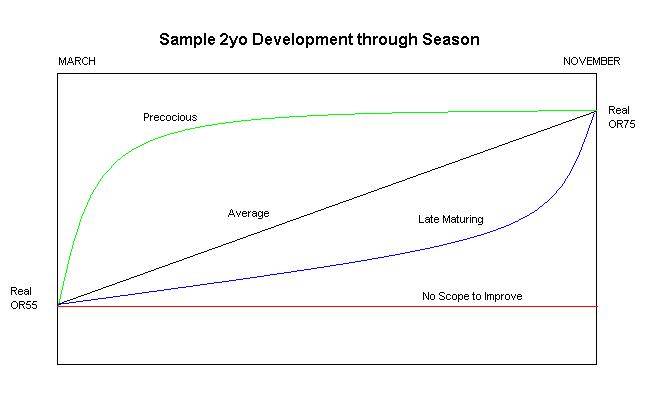
relative handicap for 2yos. Hmm, look at the following simple diagram to
try to get a handle on this.
|
|
Let us take a 2yo in March who can run to a real Athletic Rating of 55 on an absolute scale. They have the normal scope to develop and will be a 75 horse by season end and when the handicap is published in later July that is the rating they will have because the official handicapper has to assume that there is no internal WFA for 2yos. They have to assume the 'average' horse is at an average state of development at a single point and base the whole relative handicap against that.
Now, consider the flat red line at the bottom of the diagram labelled 'No Scope to Improve'. This represents the early season, sharp & ready, rabbit. That stuff about long bones growing etc. do not apply to them much and they, in this extreme example, are already the finished athlete. The season progresses and the average horse gets 20lbs better but they go nowhere in physical terms. They were real 55 raters on the notional 'Absolute Athletic Scale' in March but as the baseline for 2yos shifts upwards they get left behind.
But, let us imagine the rabbit ran three or four times on the AW at Lingfield in March and early April and finished second on all runs so it has 'demonstrated' it's ability enough to run in handicaps. It then doesn't appear again until August 1st when it is declared for a Nursery - what can the Official Handicapper do with it? He has to assume normal development and cannot take into account, overtly, any underlying WFA development of the 2yo form. That rabbit will be an OR75 rater exactly like the average horse and it's hopelessly out of his depth. But, from a form perspective he has some placed form to his name and runs for a reliable trainer so you cannot discount it. Until he runs a series of shockers off the inflated mark on his way to perhaps being competitive as a 40-45 horse at 4yo+ if it's lucky as the baseline gets even further above it as the 3yo 'stagger' unwinds.
The 'Average Horse' and the 'No Scope Rabbit' are two examples from a range of physical types and development paths of course. Because the thoroughbred is quite in-bred and the basic ability range not too wide the 'No Internal WFA' handicapping approach can work quite well to produce presentable racing (helped by racing styles which don't spread horses out to the full extent). But it does lead to a lot of horses being over-rated and many races where there is a long tail of uncompetitively weighted horses and the few with a little bit of scope to improve are much taller 'Poppies' than they might seem. If you get a nursery where everything is over-weighted compared to their real ability this will roll on into other recognisable problems. The form pundits will say the winner and placed horses showed 'improved' form when they did not have to because of the race 'shape'. When they all compete badly in later runs in nurseries with better treated horses in them the weakness of their win and placed form will become clear. If you could accept that winning doesn't always equal improvement you could avoid the disappointments.
The diagram includes two, relatively extreme, example of how an individual horse might develop physically in making that 20lbs of improvement through the season. The green line labelled 'Precocious' shows the horses who develops quickly and is close to that peak in May and will compete well in early Nurseries. But, they aren't developing much after that and the better placings, and presumably a win, they showed in that period when they had an advantage means they will be over-rated in later season as well. If you look at how their development has flattened off you would worry about them being competitive off their handicap marks as 3yos as well. They've still got to make 10lbs plus of improvement to 3yo and the line isn't going up much. The type of horse, for example, that gets an 80 official rating at 2yo but then hardly manages to scrape a place at 3yo as the official rating declines. It then wins as a 4yo with the OR down to 66 and the 14lbs difference from it's 2yo peak figure is the lack of physical development potential it had being handed back to it by the handicapper as a downgrade on the Absolute scale.
The blue curve (it is blue) labelled 'Late Maturing' is the other classic end of the scale. The horse makes the normal 20lbs improvement through the season but lags behind the normal until late September onwards then 'comes to itself'. With some trainers this type of horse might not run much at all at 2yo and perhaps just a couple of late season maiden outings. If it's sprint bred or with particular trainers it might have been running in earlier and mid-season and looking uncompetitive against the average horse, let alone the precocious ones. But, the official rating it gets will be low and when it's improvement kicks in later in the season it's going to beat a field of over-rated types in a Nursery by some margin. It's also likely to still have some improvement left and carry on competing well and winning into it's 3yo season until it reaches it's natural level, say OR88. It will then find itself finishing 4th to midfield no matter how hard it tries because the handicapper will have overshot and have it rated in the 90s before it settles back. These career paths for 2yos should be recognisable to anyone who follows racing and it comes back to physical ability, development type and how that interacts with the way the handicapper has to operate.
The following simple diagrams presents the same paths but in a different way. On the left side up-down axis those horses that were real 55 raters on the absolute scale of all horse ability has been shifted up, inflated, to be rated OR75 which the handicapper will assume they are in his 'whole season' viewpoint. The 'Average' Horse is in about the right place and will compete averagely. It might manage to win a poorly contested nursery if things fall right and there aren't any improvers or under-raters. The 'No Scope Rabbit' is in off OR75 and is on it's way down to being an OR55 by season send and the decline will continue. It is too far over-rated to even manage to fluke a win in a weak nursery.
In between will be those with some scope to develop but less than the average. By the time the nurseries start they will need some relief from the handicapper in terms of a decreased OR to compete, Unless they can find some improvement physically they are in trouble for their future careers because that gap looks to be widening.
 |
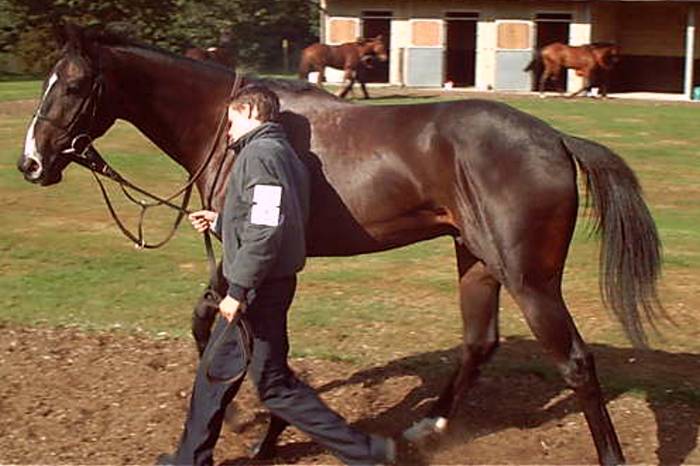
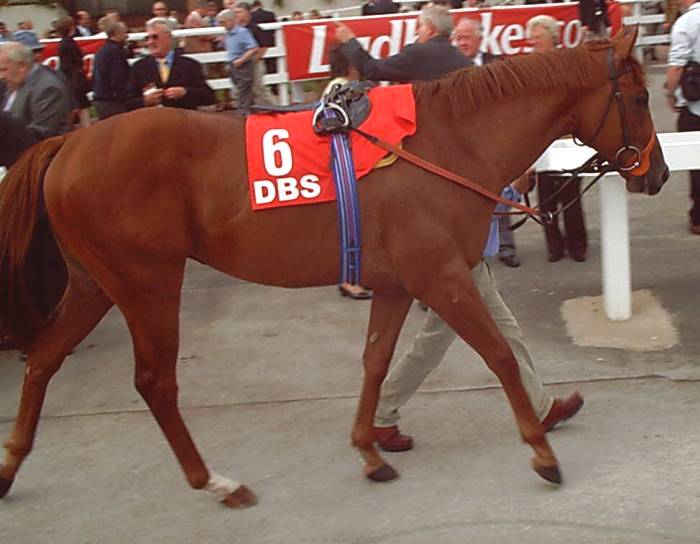
To make the point let us take a real example to see how this can unravel as a real career. A good example is the 2006 juvenile Hephaestus who ran for trainer Mick Channon. The link goes to a picture of him in August of his 2yo career and he's small, not particularly well put together nor powerful, but filling out a little but with less than the average scope to develop. [It would be advisable to get a listing of all of his career runs on one page to refer to. The 'Racing Post' allows you to search for a horse by name on the front page and this links to a good example of the list for this purpose.]
He ran in the second race of the 2yo season on March 23rd and won in a slow time. As a winner he is then struggling for races to run in until the nurseries start in July. He can't run in maidens, he cost 17,000gns so you wouldn't want to drop him to sellers or claimers just yet but he isn't good enough to win a Novice or Conditions race with his winners' penalty. What to do? Nothing until July and then run in a few races to see how he goes. Not very well including in the Supersprint at Newbury and a little Novice race at Bath. Time for Nurseries and hope that the three recent unplaced runs will have taken the edge of the OR75 you expect.
First nursery run on August 6th and he's perched on OR72 which is still too high for the gap between him and the average developer. With many trainers this would be a showstopper but Channon is willing to run 2yos umpteen times a season if needed and get rid of them. He isn't a small trainer who can't afford to treat horses in an expendable way because that's a tenth of their string (and training fees) gone if they offload it or use-it-up now. Five more handicap runs in the next six weeks, not a stiff schedule by Channon standards, gets him down to OR64 to win a Class 6 nursery. That gets him back up to OR68 and he's 3rd and 7th in two follow up runs.
That 7th in a Class 4 Novice (not a handicap) proves to be a big mistake and demonstrates the handicappers very literal approach to form. The race was slowly run and on timefigures Hephaestus ran to his typical level. But he was beaten only 3.5 lengths because the race didn't spread the abilities out fully and in 'Form' terms looked like an improvement. The BHA handicapper stuck him up to OR73 and Timeform rated it 73, but with a '?' to indicate they weren't sure about it. The cynical view is that a shrewdie like Channon knew exactly what he was doing running him in that Novice race. The idea was to inflate his OR and make him look like he had some improvement left. Why would you do that?
Because, the next stop for Hephaestus was the 'Horses In Training' sale and you can bet an awful lot the auctioneer played that Novice race run up as a good leap forward and presaging more to come. He fetches 14,000gns and 3,000 less than he did as a yearling. But the owners have had some fun and he won two races so an above average result in horse buying terms. What about the person who bought him, oh dear. When this article was written he had run 11 more times to the end of his 3yo career for a single place. His OR has declined from that inflated 73 down to 45 and the line in the second figure above suggested that is where he was going.
This isn't a contrived example to fit the article it's a typical career path for a certain type of horse. There are a small range of other basic paths which fit with how physical type and development rate interact with trainers' methods and the handicapping system. Pick up a 'Ledger' type book with career listings in the single line summary form, or look at the 'Racing Post' horse pages and you can see the 'careers' types developing. If you were having a good Paddock Review day on March 23rd, 2006 at Lingfield and knew about Channon and the handicapping system you could have foreseen a lot of what unfolded. By August at Folkestone you would have 'known' what to expect.
So, we have an Official Handicapping system which has to make assumptions and over-rates a lot of horses. Early season form is suspect and running in certain race types and Classes leads to erroneous ratings in many cases. This comes about mainly because the handicapper isn't looking to rate early season races and maidens in general for the actual level of form they produce. They are looking to get to the typical rating that type of horse should be on and using the race Classes, trainers, and so forth as the main clues (forms of 'Race Standardisation'). Because most races have reasons why they don't reach full ratings standards the BHA handicapper is always making some sort of educated guess about the true abilities of the horse.
The B2yoR ratings have developed with two main changes to try to get a different view. The first is that the aim is to rate any race for the actual achievement for the most part and not add in some weighting for the Class or type of race. The classic example of this is with Listed and Group races which the Official Handicapper always inflates up to expected levels no matter what the real abilities on show (which can vary a lot, see later section). Instead, put aside Race Class information and just rate what occurs. This, along with believing how poor early season form can be, is a very difficult bias to overcome even for those not drilled with traditional handicapping methods.
At this point some readers will no doubt be saying why not just use Time based figures which aim at identifying raw performance. B2yoR would have a lot of sympathy with this view. A person who bets consistently using a set of well produced time figures will avoid falling into many of the traps that using official ratings, and similar handicaps will lead you into. Fair enough. But, time figures have their own problems in producing a good set of figures for a meeting with limited races on the straight course for example, changing wind speeds and direction, rain through the meeting and so forth. They also often use the 'Class' of the horses involved as some kind of indicator of how to place the time ratings produced. Which draw on the class of runners by the official ratings so they are introducing some measure, however limited, of the original problem.
We also need to respect that the Official Handicapper is trying to get to the central Truth of the 'Class Level' of each horse but the assumptions and implementation mean that this often gets blurred and takes a lot of runs to emerge. But, the ideal of the 'Class Level' is sound and worth pursuing. So the other main difference for the B2yoR estimates is to use the basic physical rating for the horse as the major 'clue' rather than race class and so forth. This has the advantage that it is visible to a large extent when the 2yo walks into the paddock on debut. It also has the advantage that the issue of scope to develop physically can be factored in.
This is the B2yoR 'Horse Standardisation' approach. For example, if a field of runners for a juvenile Group 2 or 3 race physically look like a bunch of prospective OR88-90 handicappers as older horses then that sets the rating Class for the race and not the 'Group 2' tag. [Try looking up Godfrey Street in your Ledger or the 'Racing Post' site to make the point that the career path examples are always there to support the approach. OR107? What were you thinking.....]
Ok, so you want to rate the races for actual achievement but factor in the Class Levels for horses from Day 1. How can you present that to people as a single figure that they are used to with a post event Official Rating for a race? You cannot, of course. It's two numbers of which one relates to the race quality and the other to the innate horse Class. The B2yoR site publishes the race performance figures as [Estimates] which often look very low compared to the Official Ratings because the need to make that figure the horse's prospective handicap mark has been removed. The Class figure is kept separately and not published drawing on Paddock Review, race video review etc. The B2yoR site does, currently, produce pre-race [Profile] figures for horse which is where these two figures become a single number as the expected performance for the day.
Given the introduction it is no surprise that the B2yoR [Estimates] have developed over a period as different approaches to solving the general issues with handicapping have been tried. The approach in 2007 was to push down further on the ratings levels that had been given in the previous two years to drive them closer to pure performance ratings.
Losing the approach and view that the Official handicap has can prove very difficult for anyone who has grown up with that model as the backdrop. Believing just how low quality the performance is (that's expressed performance and not the horses themselves necessarily) is very difficult, particularly with early season form. Understanding that Group races can be won with just good Conditions race performance levels is also difficult to accept. If years of experience has had you listening to pundits doing the 'Emporer's New Clothes' bit selling any high class race the clear-headed view of what is actually before you can be difficult to focus through to.
The outcome of the push down in the 2007 season on [Estimates] was to leave the early races rated too highly relative to the later ones and the overall Ratings Scale too low. Over the winter the ratings for all 1,030 races were reviewed with the initial plan to downgrade all of the 'early races' by 20 points. Using the model above the idea was that the downgrades would go down to zero at some point (say around races 250-300) as the effect of the internal WFA of the season unrolled. The downgrades decreased down to a pretty constant -8 around race 500 but the downgrade, and any individual race anomalies, were continued through to the final race on November 10th.
Reviewing the second set of figures the first 200 or so of the races still looked to be too high in that horses were running close to, or at their best Class Level on the early debut masking any possible later season improvement. The poor times relative to the rest of the season, even on the firmer going in early season confirmed the view that the early races were weaker than even the original downgrades supposed. The first 208 races were further decreased in ratings level to produce a final set of ratings.
The B2yoR scale is on a 0-100 basis and not the 0-140 official level. Part of the reason for this is that a lot of the higher ratings, say of 90+, and certainly over 100 in the official scale are just not 'real' and are not backed up by actual performance. Only a few really high class individuals put up real high class performances each year. The Official Rating model can mask these real high class performers in the general upgrading of runners in better races to expected performance levels for the race. One way the handicapper gets around this is to hoist the best horses in the Group 1 races even higher than this over-rated second and third tier. This isn't going to get tested much in handicaps but is probably the source of the commonly held view that the 'jump' in quality between high class handicaps and the Group races is a big step. In most cases it is much less than the top of the handicap would have us believe.
After the downgrading exercise over the winter it left the overall base of the [Estimate] scale too low with, for example, only 19 ratings over 70 out of more than 10,000 2yo runs. Therefore an across the board increase of 20 points was used to place the reworked ratings higher on the 0-100(ish) scale. The final results left New Approach's Dewhurst success as top rated on 112.
To follow up the point about how high class performances are actually much rarer than the official ratings would suggest only 6 runs in the season rated above 100 on the reworked B2yoR [Estimates]. The second and third behind New Approach at Newmarket (Fast Company & Raven's Pass), Kingsgate Native's Nunthorpe win and the first two in the Cheveley Park Stakes with Natagora & Fleeting Spirit. Only 19 runs rated above 90 in total and Ibn Khaldun's win in the Group 1 Racing Post Trophy at 96. It may have been a Group 1 he won but it wasn't a 'Top Class' performance.
The biggest downgrade to a race was of -42 for Thunder Bay's win for Channon in the third race of the year at Lingfield. The Newbury maiden that Winker Watson won at Newbury in April looked a strong race on profile and taking win by Winker Watson. But it was over-rated by 38 points in performance terms and led to a lot of problems in believing the likes of Party In The Park was better than he really was. On the day you could tell that Winker Watson was useful but the raw performance wouldn't have told you that and trying to bend the rating to reflect it just dragged lesser horses up to levels they shouldn't have been at.
As is often the case you have to infer Class from paddock review and manner of the success. Fast Company's unusual show of a change-of-pace on his Salisbury debut was perhaps the best example in the season. The performance level wasn't good but the way he did it told you he was the real thing.
The ratings on the B2yoR website are those assigned during the season for reference. The new ratings set are available on request.
Having talked though the Why? and the How? of the [Estimates] recasting let us now consider some items about actually using them in 2008 and being able to compare them to the Official Ratings. In an ideal world B2yoR could drop the Official Ratings and just use the [Estimates] but there are two good reason why keeping ORs in mind is useful. The first is that it is the accepted 'Language' that people are used to talking and the official scale of the races we are dealing with so, as in a foreign country, you have to speak the local language to communicate.
The second point is that B2yoR has years of experience of reviewing horses at the track and the OR scale is the one that got attached to the mental model and pictures as the experience developed. A '75' horse, on the OR scale, pops up a number of mental images of the type horse to expect and as reference to ones being looked at on the day. While the B2yoR [Estimates] are developing you cannot move those mental references. In general it is likely to be extremely difficult to move to the new ratings in that sense because the mental imagery is so well ingrained. [Like a golfer, say Nick Faldo, who has been told he needs to remodel his swing to make improvement when his current swing has already got him a very long way in the game. During the remodelling they'll be fraught times when you go backwards and wonder whether you have a less sure grasp on matters than you did at the start. That's the risk.]
The B2yoR scale is basically a 0-90 with with just a few very high class performances above that level each year. In 2008 the site will also record negative figures rather than just cutting the scale off at 0. The unit is still at the 1 point equals one pound level - you can't ditch the Official Model entirely. The bar graph below shows all of the runs by 2yos in 2007 grouped by 10 point [Est] rating groups, i.e. 1-10, 11-20, 21-30 and so on.

The shape of the graph is quite pleasing in that it occurred naturally out of the downgrading of races rather than being the template before the start. As with distribution of heights in children at a school, etc you should expect it to be some version of a 'Bell Shaped' (also called Normal or Poisson Distributions) curve with a reasonably symmetric shape around a central peak.
The graph shows a steeper front edge to the curve above 50 and a slumping to a longer tail below 30. Since there are more ways for a horse to underperform (missing breaks, inexperience, ground, illness, injury, plain unwillingness, etc) in a race than to reach it's potential this is what you would expect.
The Average Estimate across all runners (10,919) is 27.3. If you discard all the ratings below -20 as 'too bad to be true' in some way you end up with 10,316 runs at an average of 31.4.
The Average Estimate across all winners (1,034) is 52.4.
The table below shows all of the 2yo races in the 2007 season broken down by the Race Classes. The BHA system used 6 classes for 2yo races in 2007 with the best races, those at Listed & Group level, accorded a Class 1 categorisation. Class 2 would account for the best Conditions events and the valuable Sales Races. Class 3 would include a few of the top maidens at places like Newmarket, Newbury and Goodwood. The bulk of racing in maidens, auctions events of the two main kinds, nurseries, claimers & sellers are then spread across the 4-6 range.
A big point to understand is that other than the
nurseries which have an OR range assigned to them the other events get
into those 3-6 class ranges by the amount of prize money. You can
have a Class 3 selling race if someone is willing to put up the prize money
to reach the minimum level for that Class of race.
| Race Class | Number of Races | Average Winner [Est]
(Max : Min) |
All Runners
Average [Est] |
Winner - All |
| 1 | 62 | 77.2 (112 - 56) | 56.8 | 20.4 |
| 2 | 44 | 64.4 (89 - 46) | 42.2 | 22.2 |
| 3 | 58 | 59.9 (78 - 41) | 37.0 | 22.9 |
| 4 | 265 | 54.5 (79 - 30) | 28.8 | 25.7 |
| 5 | 409 | 50.1 (80 - 19) | 23.5 | 26.6 |
| 6 | 186 | 41.5 (66 - 11) | 15.2 | 26.3 |
The cream coloured third column of figures is the average B2yoR [Est] for a winner of that Class of race during the 2007 season. The figures in brackets are the lowest and highest ratings accorded to a winner. This is a really important issue to grasp - although the average winning figure decreases from Class 1 down to 6 there is a huge overlap in all cases. The worst winning performance in a Class 1 race was behind that of some of the better Class 6 efforts. That's performance, not horse necessarily remember, because Class is separated out of having to be in the race performance figure.
When a pundit blithely states that a runner is 'dropping down' from a Class 4 maiden to a Class 5 so he should have a strong chance it may not be the case. The pundit will not have had time to assess the race fully because of the amount of racing but has to say something. They will fall back on crutches like 'Class Dropping' and the like. On average, going from a Class 4 to a Class 5 race will mean a 4-5 point easier race performance needed. But, if you are dropping from the worst of the Class 4 races (which got a 30 [Est]) into a well contested Class 5 like the maidens won by Maze & Screen Star in the North you are going to get ironed out at a valueless SP. The pundit might as well read the phone book to you.
In a section full of big points to note here is a Another. The table above uses the B2yoR [Est] to answer a question about the quality of performances in Classes of Race that normal ratings cannot. If the ratings you are using take into account the class and type of the race to place the ratings on the scale in the first place you simply cannot address the question. You get the answer you designed the ratings to have. The lower level and minimum ratings in the table above for the six classes don't exist in your model except for the sellers in Class 6 which want to be low ratings..
Regular readers of the website will be aware of the idea of 'Class Levels' for horses. They will have a best rating level that they can achieve and very few will develop beyond this in an abnormal manner. If they do it will often be visible in their physical development and improvement in general condition. Because many maidens and development races don't demonstrate the Levels because they are not all-out affairs the Class can be hidden. As discussed at length above the BHA handicapper places the horses from certain races at typical levels as part of the method for bypassing this. The true Class Levels will then emerge as the handicap racing develops.
To make the point you can easily find examples of
older horses who can only win once they get down to a certain handicap
mark. They win off 68 when they are close to peak form and compete well
off OR71 next time and get up to OR73. Their peak condition passes by and
they are now finishing behind the places and into midfield. It takes them
some number of runs to get back down to the OR68 point and they aren't
in the best physical form now. They drop a little further and the trainer
brings him back to peak condition and he wins two off OR62 and OR68 before
stalling off OR71 again. This is his Class Level being demonstrated.
The question then is how quickly can you identify
what the 'Class Level' is for a 2yo? A big subject and ongoing one for
research but some highlight points are :-
Try this piece of mental picturing to get a real handle on this. Imagine an overhead picture of the finish of the Coventry frozen as the winner's nose hits the line. Now, take the bell-shaped curve from the section 5 chart above and place it flat on the overhead picture. You'll have to flip it over so that the right hand trailing edge of the curve is pinned to the winner. The distances back to the beaten horses will then be a visual match to that scale of declining ability, i.e. Class. If you take the height of the graph to be the number of horses you expect to be in that part of the picture it will almost certainly match the Coventry Stakes finish as well. One horse clear on the leading edge, only a small number within reasonable distance. Behind that will be a peak where the midfield 'ruck' are who equate to the typical ok winners who aren't better class and will be OR70-84 types in their careers. There will then be a trailing tail down to the overfaced try-ons who were there for the day out and those that failed badly for some reason.
The same thing happens at all levels during the season but is often not as clearly demonstrated. In a maiden race if a horse has the class to run to a B2yoR [Est] of 60 they set a very tough standard for all but the very best of the others. The opponents with any pretensions to this sort of Class will almost certainly be identifiable on profile and definitely on the day at the course. The reverse side of this is that long priced winners come about when there isn't a better Class runner in a race (at whatever [Est] range) and therefore a range of horses can meet the standard. The other possibility with long priced winners is that a higher class 2yo has been under-estimated by the Market. The only way to find these regularly is to go and look at them before the race.