BRITISH 2YO RACING: 2002-2006
Sire/Dam General Stats
General : Note that there are separate sections
available via the links on the site homepage which provide detailed stats
for individual sires This section covers general stats about the overall
sire population. Questions covered in this section are:-
-
How many different sires had 2yo runners
in each season?
-
How many different sires had 2yo race wins
in each season?
-
Does the age of a runner's dam make any difference
to its chances of winning?
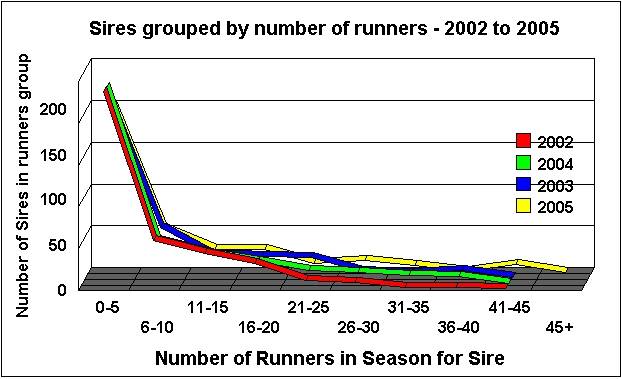
1. How many different sires had 2yo
runners in each season?
| Season |
Total Sires |
Sires with between 1 to 10 runners |
Sires with between 11 to 20
Runners |
Sires with more than 20 Runners |
| 2002 |
359 |
264 (74%) |
69 (19%) |
26 (7%) |
| 2003 |
342 |
251 (74%) |
49 (14%) |
42 (12%) |
| 2004 |
368 |
264 (72%) |
58 (16%) |
46 (12%) |
| 2005 |
329 |
233 (71%) |
52 (16%) |
44 (13%) |
| 2006 |
339 |
247 (73%) |
52 (15%) |
40 (12%) |
Note:(a)
Back to Top of Page
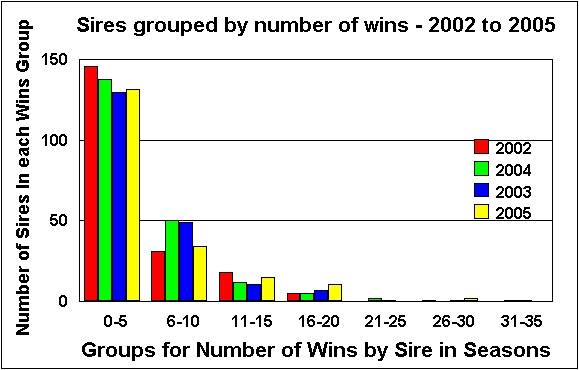
2. How many different
sires had 2yo race wins in each season?
| Season |
Total Sires with at least one win |
Sires with 1 to 5 wins |
Sires with 6 to 10 Wins |
More than 10 Wins |
More than 20 wins |
| 2002 |
201 |
146 (73%) |
31 (15%) |
24 (12%) |
|
| 2003 |
200 |
130 (65%) |
49 (24%) |
21 (11%) |
|
| 2004 |
208 |
138 (66%) |
50 (24%) |
20 (10%) |
|
| 2005 |
194 |
132 (68%) |
34 (18%) |
31 (16%) |
3 |
| 2006 |
189 |
129 (68%) |
35 (19%) |
21 (11%) |
4 |
Note: (a) Approximately 55-60% of Sires have
at least one winner. .
(b) Percentage figures relate to the proportion of sires with winners
in each classification group
Back to Top of Page
3. Does the age of a
runner's dam make any difference to its chances of winning?
While following racing you will hear various biases expressed relating
to the age of dams and their ability to produce competitive racehorses.
These usually take the form of doubting the ability of first foals or the
products of old dams being less competitive. The table below shows the
wins-runs by different foal numbers relating to 2yo racing in the 2004-6
seasons.
It would be interesting to extend this table to take account of class
of runner by foal number. For example, although older dams can produce
competitive 2yos, are they at a lower level, on average, than the product
of younger dams?
|
|
2004 Season
|
|
|
|
|
2005 Season
|
|
|
| Dam's Foal Number |
Number of Runners |
Number of Runs |
Number of Wins |
Wins to Run Percentage |
Dam's Foal Number |
Number of Runners |
Number of Runs |
Number of Wins |
Wins to Run Percentage |
| 1st |
654 |
2354 |
216 |
9.1% |
1st |
560 |
2056 |
189 |
10.9% |
| 2nd |
453 |
1671 |
180 |
10.8% |
2nd |
472 |
1827 |
173 |
9.5% |
| 3rd |
393 |
1433 |
154 |
10.7% |
3rd |
442 |
1672 |
173 |
10.3% |
| 4th |
365 |
1348 |
145 |
10.8% |
4th |
339 |
1232 |
127 |
10.3% |
| 5th |
271 |
957 |
74 |
7.7% |
5th |
278 |
1038 |
92 |
8.9% |
| 6th |
213 |
765 |
61 |
8.0% |
6th |
224 |
804 |
76 |
9.4% |
| 7th |
168 |
535 |
53 |
9.9% |
7th |
163 |
561 |
65 |
11.6% |
| 8th |
134 |
407 |
35 |
8.6% |
8th |
116 |
400 |
40 |
10.0% |
| 9th |
98 |
361 |
26 |
7.2% |
9th |
88 |
261 |
17 |
6.5% |
| 10th |
72 |
222 |
15 |
6.8% |
10th |
64 |
217 |
16 |
7.4% |
| 11th |
53 |
206 |
22 |
10.7% |
11th |
56 |
207 |
14 |
6.8% |
| 12th |
34 |
84 |
4 |
4.3% |
12th |
35 |
110 |
6 |
5.4% |
| 13th |
34 |
136 |
9 |
6.6% |
13th |
26 |
79 |
5 |
6.3% |
| 14th |
3 |
7 |
0 |
0% |
14th |
16 |
67 |
3 |
4.5% |
| 15th |
3 |
5 |
1 |
20% |
15th |
4 |
16 |
0 |
0% |
| 16th |
1 |
4 |
0 |
0% |
16th |
1 |
3 |
0 |
0% |
Note: Overall Totals slightly low in 2004
because of 10 horses with unknown Foal number
|
|
2006 Season
|
|
|
|
|
2007 Season
|
|
|
| Dam's Foal Number |
Number of Runners |
Number of Runs |
Number of Wins |
Wins to Run Percentage |
Dam's Foal Number |
Number of Runners |
Number of Runs |
Number of Wins |
Wins to Run Percentage |
| 1st |
555 |
2050 |
186 |
9.1% |
1st |
TBA |
|
|
|
| 2nd |
428 |
1556 |
169 |
10.9% |
2nd |
|
|
|
|
| 3rd |
372 |
1433 |
154 |
10.7% |
3rd |
|
|
|
|
| 4th |
345 |
1225 |
123 |
10.0% |
4th |
|
|
|
|
| 5th |
220 |
749 |
98 |
13.1% |
5th |
|
|
|
|
| 6th |
219 |
755 |
62 |
8.2% |
6th |
|
|
|
|
| 7th |
139 |
453 |
41 |
9.4% |
7th |
|
|
|
|
| 8th |
119 |
365 |
49 |
13.4% |
8th |
|
|
|
|
| 9th |
105 |
340 |
34 |
10.0% |
9th |
|
|
|
|
| 10th |
75 |
229 |
15 |
6.6% |
10th |
|
|
|
|
| 11th |
47 |
155 |
20 |
12.9% |
11th |
|
|
|
|
| 12th |
29 |
109 |
9 |
8.3% |
12th |
|
|
|
|
| 13th |
15 |
52 |
4 |
7.7% |
13th |
|
|
|
|
| 14th |
8 |
24 |
2 |
8.3% |
14th |
|
|
|
|
| 15th |
7 |
14 |
1 |
7.1% |
15th |
|
|
|
|
| 16th |
4 |
16 |
1 |
6.3% |
16th |
|
|
|
|
Note:
Back to Top of Page
© British 2yo Racing. All rights reserved.