2002-2014 - Period Review
Starting Prices
|
|
2002-2014 - Period Review Starting Prices |
|
|
|
|
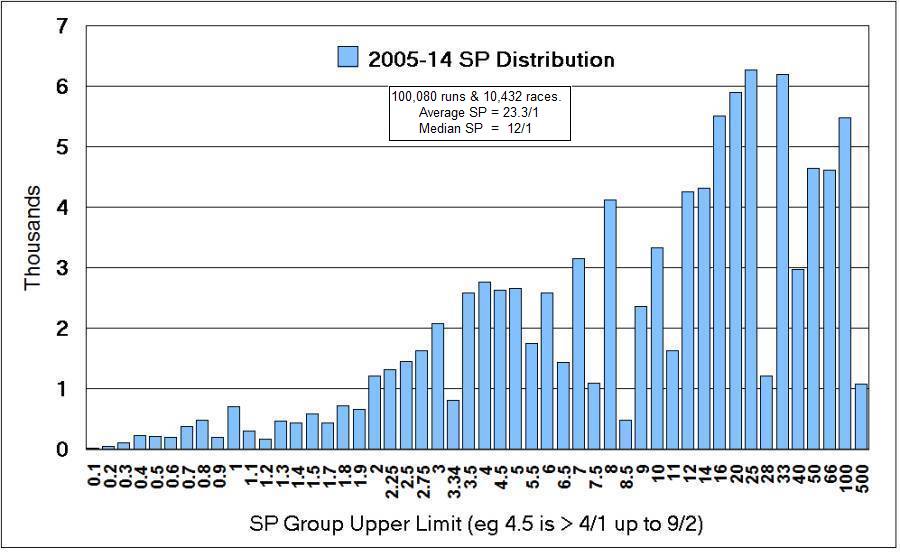
1. 2005-2014 Period Summary Sections 2-4 below present historical data based on single season data and are retained in this document for reference purposes only. In 2014 the decision was taken that it would be more useful to have a summary covering a larger set of Data. The 100,080 individual 2yo Runs in a total of 10,432 Races in the 10 Seasons from 2005 to 2014 was chosen to be the base data. The Starting Prices (SPs) used are those reported in the 'Racing Post'. The individual runs were placed into 51 x SP Groups for the summary ranging from the SPs of 1/10 (1 to 10 on) and shorter up to those above 100/1. Bar Chart A shows how the 100,080 individual SPs are distributed across the 51 x SP Groups. The shape of the distribution shows an increasing number of SPs in the Groups as the returned prices lengthen, with a peak around the 25/1 to 33/1 range. The Groupings lead to some shorter bars which 'appear' to vary from that trend but are mostly an artefact of the Groupings chosen. For example, the '28/1' grouping could have been combined with the '33/1' SPs to produce the largest bar on the graph. An interesting point is to look at the bars for the Groups '5.5' (11/2), '6.5' (13/2), '7.5' (15/2) and '8.5' (17/2) which are notably lower than whole Integer groups between them (i.e. '5', '6', '7' and '8'). Also, the first set of Groups decline in numbers represented from '5.5' to '8.5' against the overall trend and also in a different way than the '5' to '8' Groups which increase as the SP increases. This is presumably an artefact of how the SP Returners decide on what SP to make as their 'Official Return'. It would be interesting to have an explanation for why the 'Half Integer' returns do not match the overall pattern. Note that the Median SP is 12/1 across all 100,080 returned SPs. Chart A : SP Distribution by SP Group in Seasons 2005 to 2014
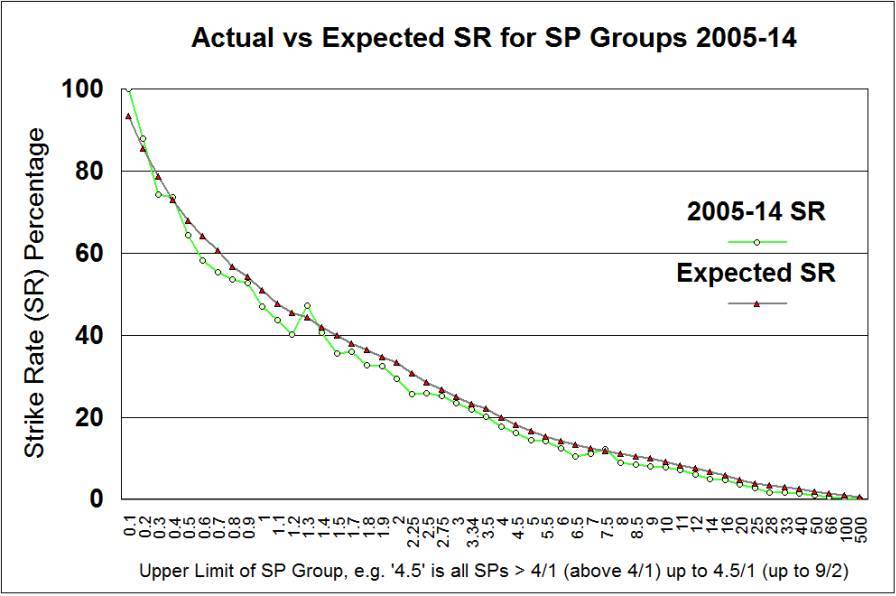
Chart B following shows how the Wins to Runs percentage (the 'Strike Rate' or 'SR') varied between the 51 x SP Groups. The True Average SP was calculated for each SP Group and is plotted on on the chart as the 'Expected Strike Rate'. This line represents the results you would see if the representatives in each SP Group won at exactly the same rate as the True Average SP turned into a probability pecentage. The use of data for 10 seasons rather than a single season has smoothed out some of the spikiness present in the single season graphs. An initial reaction would be that the Actual SR line follows the Expected SR line quite closely and nearly always with a SR just beow the Expected level. This is what we would expect because the 'bookmakers' (of whatever kind) do not offer the True Odds. Instead, on average, they offer some percentage below the True Odds and that is their margin which would match their profit if they could produce a balanced book on every race. The Group of horses at 1/10 or shorter numbered only 18 with all of them winning. The 1,083 horses who started at longer than 100/1 produced a single winner in Bermondsey Bob's third time out success at 150/1 at Salisbury in 2008. In a couple of places, aside from the very small numbers in the very shortest SP Groups, the Actual SR exceeds the Expected level. Those are for SPs around 1.25 (5/4) and 7.5 (15/2). It will be interesting to see whether those are just anomalies that will be smoothed out with a larger Data Set or represent some sort of 'Break Points' in how SPs are Marketed and Returned. Chart B : Wins to Runs percentage by SP Group in Seasons 2005 to 2014 - Actual vs Expected
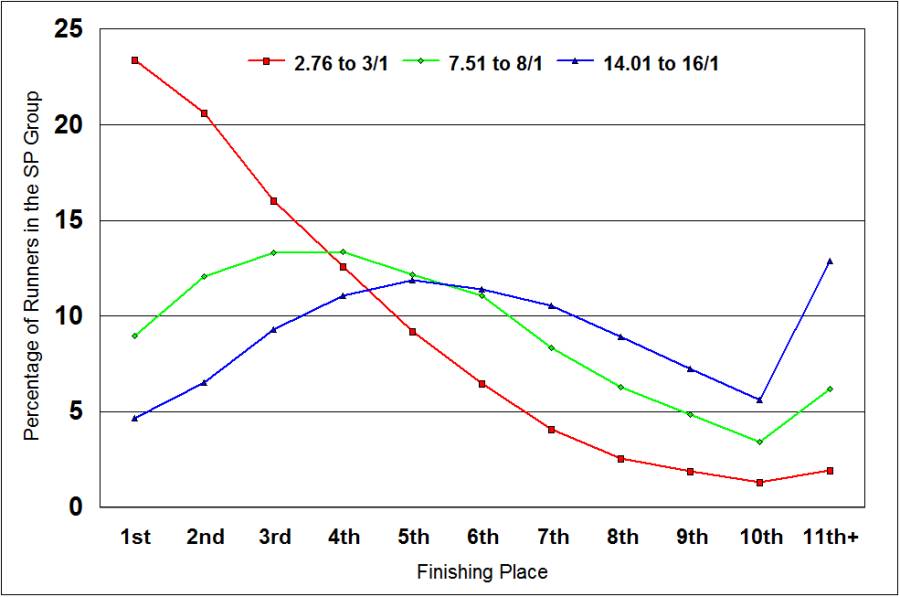
Looking at the previous Chart with the Actual SRs mostly following the Expected SRs neatly could have you thinking that 'The Market' does know a lot. Perhaps all that 'Wisdom of the Crowd' talk means that it is close to impossible to find an edge and make a profit. But always worth remembering that the Chart shows a long term average of Starting Prices. Even 'The Market is close to Perfect' devotees will admit that the Market gets more accurate closer to the Off-Time for a race and there will be value in selectively assessing the Opening Prices and reacting to earlier Price Moves. Chart C presents another way at spreading out the data averaged over a 10 season period. It shows the results of taking 3 example SP Groups and plots the distribution of finishing position by the members of the Group. For example the Red Line shows the spread of finishing positions for 2yos with SPs at 3/1. The True Odds for a 3/1 shot of placing first is 25% and, as expected, the Actual percentage of winners is a bit below that level. The Bookmakers having shifted the Odds towards their advantage. The line then tails away across the other finishing pocitions. The other two lines are for the 2yos at 8/1 and 16/1 across the 2005-14 period. They have different shapes to the distribution line. But, the important message to take out of the Chart is the spread of finishing results for each Group. The 3/1 shots are spread across all the finishing positions. Some of those that finished unplaced in the 3/1 SP Group really were 2yo's with 3/1 chances on their pre-race profile and the information known at that point. But, many were at the wrong SP and there are clearly Edges in being able to exclude the poor value 3/1 shots and work at finding more of the competitive 3/1 horses. The key is to work hard enough to identify the information sources that The Market is mis-reading or does not have. In 2yo racing the feedback from physical inspection of the horses in Paddock Review before a race is definitely not fully assessed. Still. Chart C : Example Race Placings Distribution by SP Groups in Seasons 2005 to 2014 - Actual vs Expected
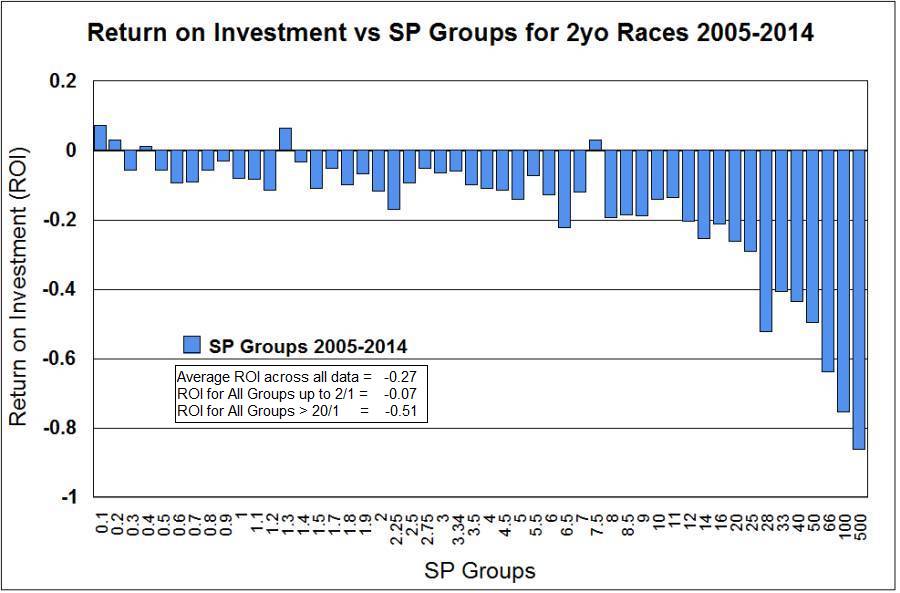
Chart D shows the Return on Investment (ROI) from placing a 1 point level-stakes Win Bet on every member of the SP Group. As would be expected the majority of the SP Groups return a loss with, for example, a 14% loss of your total Staked betting on all the 5/1 chances. The SP Groups showing a profit are the same three noted above in the text preceding Chart B. The average return across all SP Groups is a loss of 27% of all money staked. But, looking at the Chart this Average figure is clearly made up from a wide range of Loss & Profit levels across the SP Groups. In particular, note the typical 'Favourites vs Long-Shots Bias'. With Short-Priced SP Groups undervalued (winning more often than the SPs suggest, after the bookmakers' margin is factored in) by the Market Makers and the Longer SP Groups overvalued (start at SPs too short, as a Group). A Chart to make anyone think very hard about where they should be targetting their betting. Everyone wants to appear 'clever' and pick long priced winners as well as feel they are getting a 'worthwhile return' when they do pick a winner. But the Chart is saying concentrate on the shorter SPs and think long term about the level of returns. The following link goes to an Economics Research Paper - Explaining the FavoriteLong Shot Bias: Is it Risk-Love or Misperceptions? - which goes into great detail about the Bias. Also describing how widespread the Bias is, not just in Sports' Betting but showing up in a range of Financial Markets. The paper deals with a Study based on around 1.5 Million horse runs in about 200,000 races in the US between 1992 and 2001. Given that the work here is on a much smaller set of races, only for juveniles, for a different period of years and in an SP Betting Market and not a Pool Betting set-up the headline returns seem to fit quite well. Take this quote from the Paper's Introduction :- The headline figures for the Study show a 23% loss betting randomly (compared to 27% betting on everything in this Study); 5.5% losses on 'Favorites' (compared to 7% losses for the shortest SPs for 2yos here); and 61% losses betting on all horses at 100/1 or above (77% losses in this work). In the Paper the author also says - "note that betting on horses with odds between 4/1 and 9/1 has an approximately constant rate of return (at ~18 percent;...". The figure for this study of 2yo races comes to 16% losses for the same SP range and a reasonably level return across the SP Groups in that range (i.e. not large fluctuations to produce an unrepresentative 'Average'). An area that needs further thought for serious, long-term thinking, punters. Chart D : SP Groups Return On Investment (ROI) in Seasons 2005 to 2014
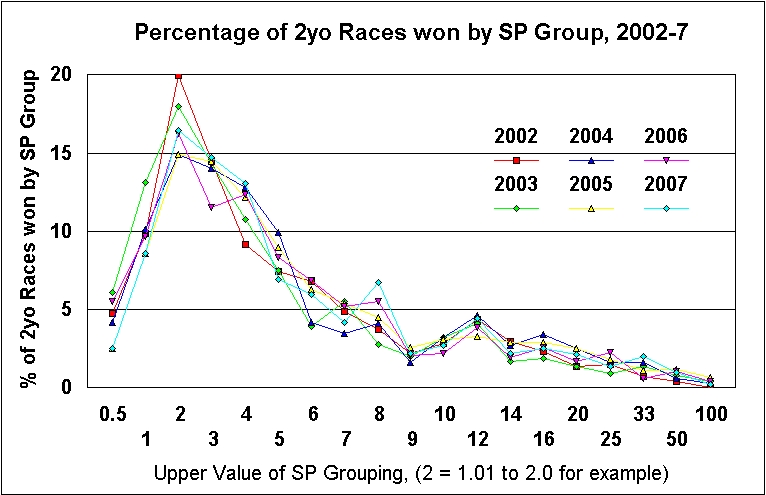
2. What percentage of the 2yo races are won within given SP Ranges? The following chart shows what percentage of 2yo races were won by each SP range in each of the seasons 2002-2007.
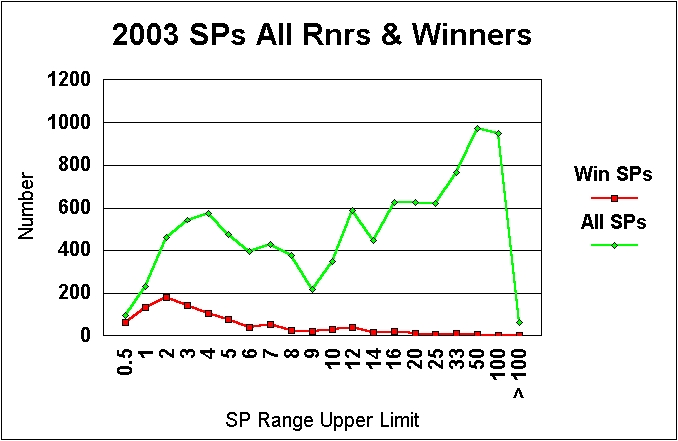
The following graph shows an example of the total number of runners (green line) within a particular SP range and the number of those that won (red line) for the 2003 season
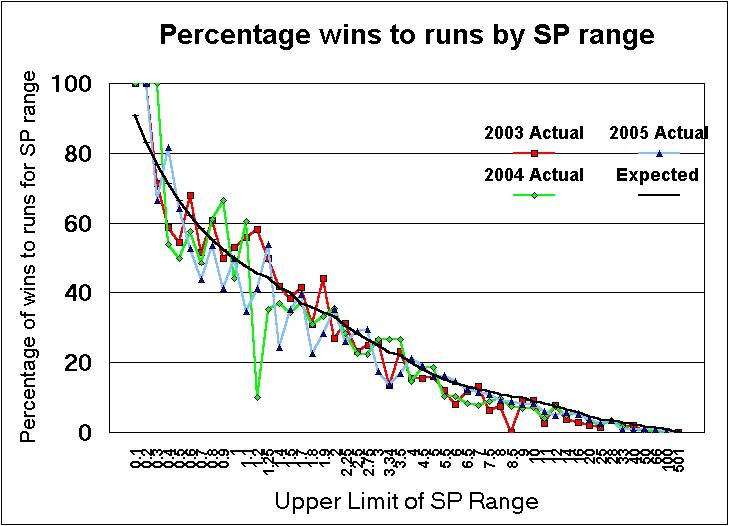
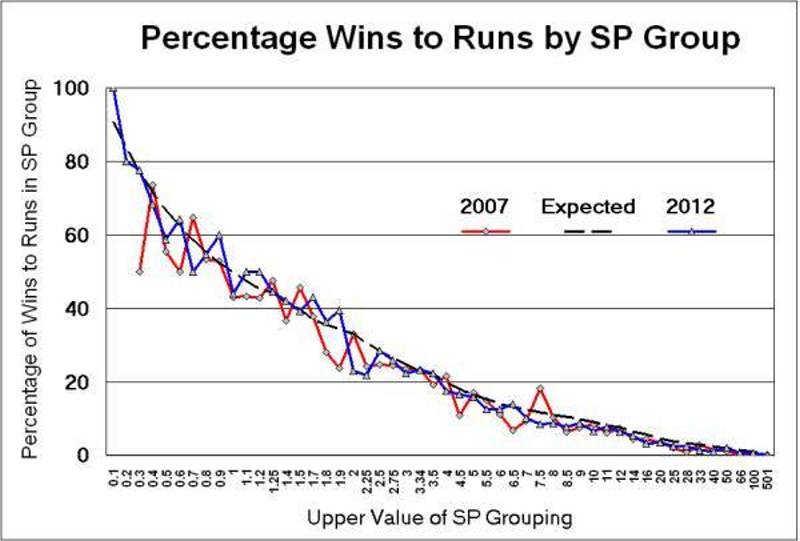
3. How does the win-run percentage match expected values within SP ranges? The solid black line in the two charts below shows the expected wins-runs percentage for each SP range. The SP ranges are represented as decimal numbers. Where the variable data lines are above the black 'expected' line it shows that the 2yo runners within that SP range won more races than the chance suggested by their Starting Price in that season.. If the coloured lines are below the black line then the 2yo runners with that SP have been less successful as a group than their SPs would suggest. The first chart covers the four years 2002 to 2005 and the second, larger chart, the two years 2006-7. Of interest has been the range 0.5 (i.e. 1/2) through to 1.25 (i.e. 5/4) which have shown a good set of examples of SP ranges exceeding expectations in the last six seasons. It is worth remembering that these are against returned SP figures. With the current competitive betting market, including Internet Exchanges, it would be normal to expect to be able to better the final SP for the majority of individual examples in each group. Chart 1 : Seasons 2002 to 2005
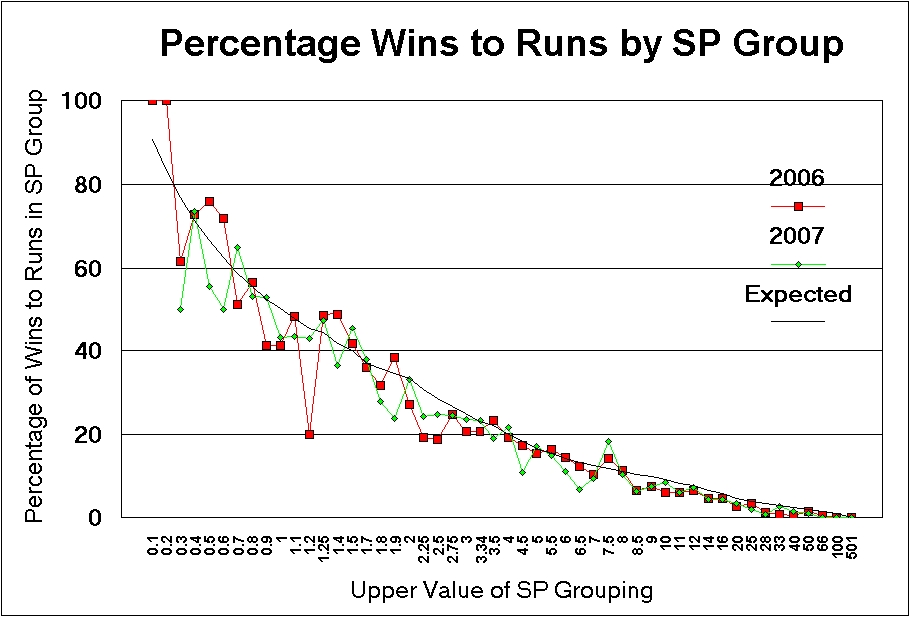
Chart 2 : Seasons 2006 to 2007
Chart 3 : Seasons 2007 & to 2012
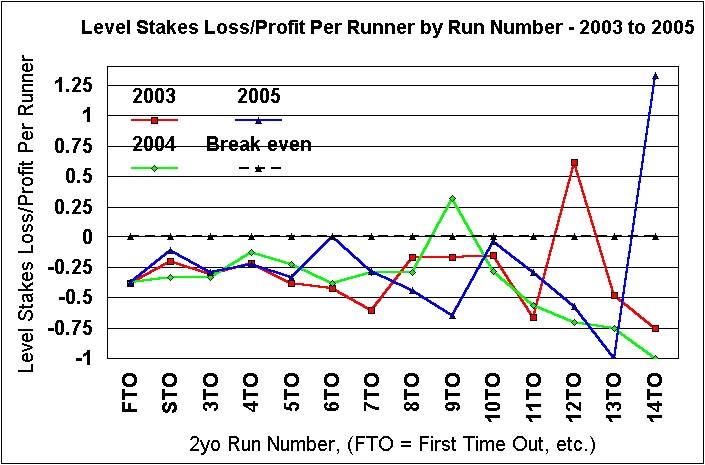
4. What is the overall Level Stakes Loss (LSL) for each run number? The following tables show the average Level Stakes Loss (and occasional Level Stakes Profile) for all 2yo runners split by the run number (where FTO = first time out, STO = second time out, 3TO = third time out, etc.) The three tables are for the 2003-2005 seasons.
The following chart presents the 'Level Stake Loss/Profit Per Runner' column from the previous tables for 2003 to 2005. The dotted black line represents the break even point whereby backing every runner in that run number group results in neither a loss nor a profit. The majority of points on the graph are below the break even line showing a loss on backing every runner in that group. The maximum that can be lost per runner is -1.0 (i.e. the level stake on all runners if none of them win). The amount the points are below the dotted line is a good indication of the amount of 'over round' that the Bookmaker has built into the SPs. This is the Bookmakers profit margin assuming they can get an ideal range of bets placed on all runners in a race.
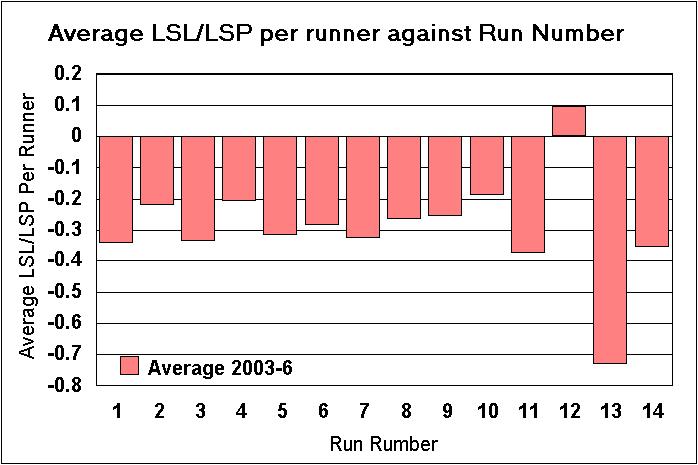
The chart shows some interesting points. The first point to note is that the few figures in Profit in each season are anomalies caused by the odd long priced winner amongst a small number of runners. They are not long term trends that can be relied on. What does appear to show up is that the 2yos on their Second (STO) and Fourth (4TO) runs show a lesser loss per runner than other outings. It is still a loss but suggests that 2yos on these outings are more competitive than the overall SP level suggests. This makes sense for runners on their Second outing because they are often at their 'peak' to compete in maidens. The majority of trainers look for a 'nice' debut run which gives the 2yo confidence, knowledge and puts an edge on their fitness. They then aim to have their 2yos close to their best STO. Something to consider when your selection process has turned up a value alternative on their second outing. The reason for the 4TO lesser loss is not so easy to pinpoint. One likely contributor is 4TO runners in Nurseries which again links to how trainers prepare their 2yos to hit 'peak' form. Unless they have already won a race then 2yos will be on their first handicap run 4TO and probably compete a little better than the average. The 4TO Level Stake Loss in 2005 season Nurseries, for example, was -0.18 compared to -0.23 in all race types. The following graph shows the similar information in a different form. The numbers along the x-axis are the Run Numbers for 2yos in the period 2003-6. For example, 1 means the 2yos first run (debut). The downward leading blocks show the Level Stakes Loss (LSL) you would have incurred in having a 1 point bet on every 2yo in that period on than run number. An LSL of -1.0 is the maximum with no winners and all of your stake money lost. The variation with runners on their twelfth outing showing a small profit is due to the small number of samples and a couple of long priced winners in the period. Note that the average loss across all runners is close to -0.3 (i.e., 30% of whatever you stakes totalled). The interesting point is that over the period and with more than 10,000 samples the runners on their Second and Fourth outing lose about 33% less than those on their First or Third. Not a fact to make you rich but an indication of a slight edge that you can think about in your overall approach.
The above graph and text was produced in early 2007 and the turf season that year produced notably different results for the First and Second Runs. The table below summarises the LSL/LSP per runner by Run Number for the last six years. Odd cells show a profit (or no loss) during a season and are in bold text. The final figure under each season is the average loss per runner if you had a level stake on every 2yo runners that year. The drop to -0.26 & -0.28 in 2005-6 would represent a shift towards the general SP level being a touch more generous for punters and the layers' built-in profit margin lessened. The cells in light blue are those where the loss in notably below the general -0.30 loss per runner. The cells in pink are where the loss per runner in notably worse than the general -0.30 average. Note how these are grouped into the second half of the table denoting the later runs and the SPs for horses on these outings are clearly much shorter than their actual chance of success.
It is worth recording that in early 2008 the system for returning 'Starting Prices' is much more fragmented and to a large extent difficult to define. When the on-course betting market was relatively strong and the major 'high street' bookmakers used on-course representatives to adjust the price at the track the returned SP system was easy to describe. With the weakness of the market at many meetings, the proliferation of online gambling outlets the SP is more difficult to identify. The problem is made more difficult currently with no agreement over which body returns the SP and a number organisations reporting them. The SPs used by B2yoR continue to be those reported by the "Racing Post" in their results section. |