2002-2014 - Period Review
Trainers
|
|
2002-2014 - Period Review Trainers |
|
|
Trainers - General Stats: Note that there are separate sections available via the links on the site homepage which provide detailed stats for individual trainers. This section covers General Stats about the overall trainer population.
|
|
1. How many different trainers had 2yo runners in each season?
 The trainer R. Hannon has had more than 90 runners in each of the four seasons with the yearly totals 99-112-97-100. The other trainer to have run more than 90 individual runners was SB Suroor in 2004 when he took over responsibility for the Godolphin 2yos from DR Loder. In 2006 trainer M. Johnston took top spot by number of runners with 102, followed by R. Hannon on 97 & M.R. Channon with 91. In 2007, assisted by a large batch of Maktoum owner breds, M. Johnston increased his total to 118 with R. Hannon still in second with 108. 2. How many different trainers had 2yo wins in each season?
Four trainers had more than 40 wins in 2014 with R. Hannon (Junior) towering over the others with 114 and 11% of all the 2yo races run. But that total was down from 130 for his father in 2013. The next three on the list were RA Fahey (64, his best total), C. Appleby (44) & M. Johnson (41). The other eight trainers in the range from 30 wins down to 21 were, in descending order, MR Channon, KA Ryan, CB Hills, SB Suroor, WJ Haggas, KR Burke, JHM Gosden & M. Stoute. 3. How many trainers used different types of 'Headgear' during the 2004-2014 seasons? The following table shows the number of 2yos that wore some form of headgear - blinkers, cheekpieces, eyeshields, hoods, visors and tongue ties - during the 2004-14 seasons.
(A) VISION RESTRICTORS The 'Headgear category' can be split into two sub-groups with the largest being those horses which wore Vision Restrictors (VR) of some kind. These are blinkers, visors, eyeshields, cheekpieces & hoods and their use has to be declared by the trainer before the race. If there is any problem with their use on the day the horse will not be allowed to run. For instance, if the trainer forgets to fit the blinkers and the runner arrives at the start without them. Note that sheepskin nosebands (known as 'shadow rolls' in some countries and presumed to stop horses shying, 'Dayjur' style, at shadows in front of them) which have long been in use, and well before the recent introduction of cheekpieces, do not need to be declared and are considered part of the normal equipment.
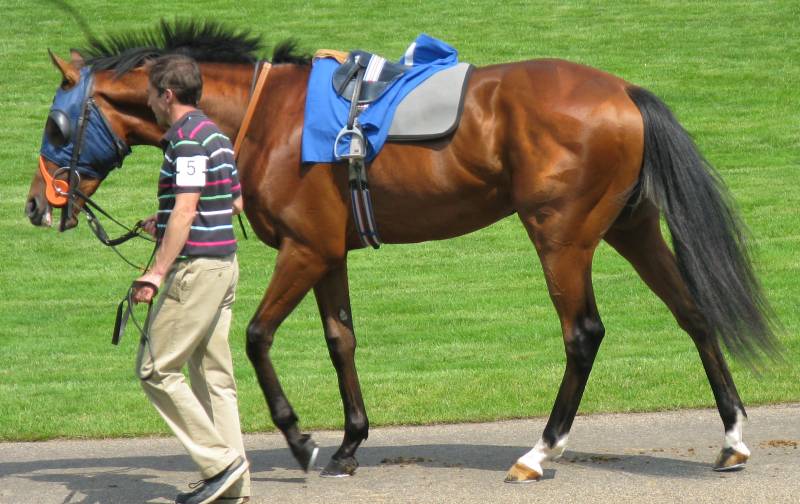
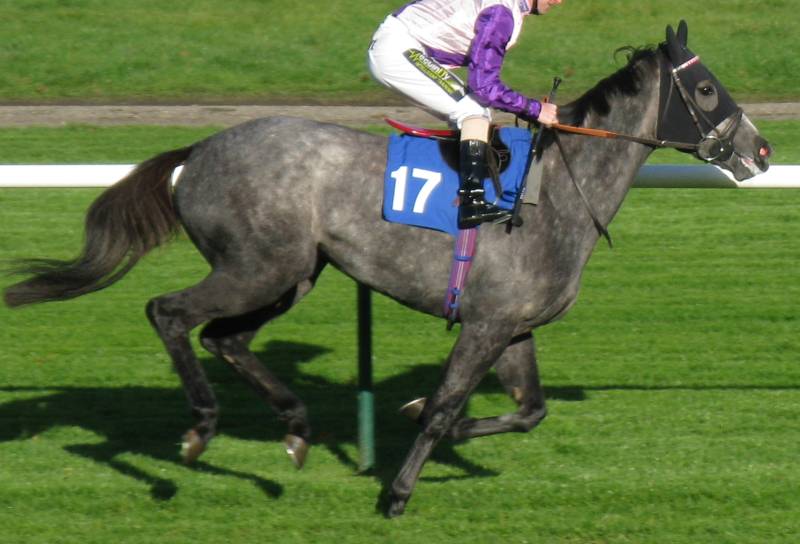
Although the use of 'Vision Restrictors' in general has remained at a similar level in recent seasons this hides a notable change in the breakdown of which VRs are used. The use of Hoods has become popular in that period and fashionable to use. The photograph below shows a horse wearing a Hood and clearly placing it in the 'Vision Restrictor' category needs some further thought. The horse in the picture has small ears but does show that the main point of using the Hood is as covers for the ears. With the ears encased in a pair of cloth covers the idea is that the horse will get less distracted by noise, be calmer and more focussed on racing.
 In 2010 there were no 2yos declared to run in Hoods. From that Zero starting point the use of hoods has increased notably in each of the following four years. In 2014 Hoods were used for 176 runs by 70 trainers. That total underplays how fashionable and widespread the use of Hoods has become. Given that they are targetted at keeping horses more relaxed many trainers used Hoods in 2014 but only during the preliminaries to the race. This does not need to be declared in advance but a request must be made to the Course Stewards if the Hood is worn in the Parade Ring. The Hood will then be removed before the horse leaves the Parade Ring to go to the start. These uses of the Hood are not recorded in the usual information sources available to the public. [Check to be made as to whether the BHA collates the raceday permissions granted by the local Stewards]. For the record, the table below shows pictures of the other 4 types of 'Vision Restrictor' :-
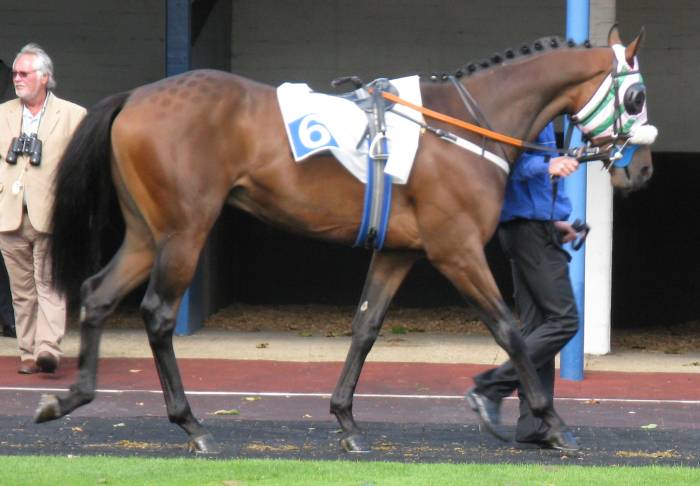
The Top Left picture shows a horse wearing Blinkers. The 'blinkers' being the rounded cups fitted into the 'face mask' and positioned around the back edge of the eye. These are solid and prevent the horse from seeing behind them. There are no rules about the size of the blinkers and in British Racing you will see them vary from being barely noticeable ridges right up to being larger than those in the picture. Note that there are no ear covers fitted into the mask so this is not classified as a 'Hood'. It is allowed to wear any combination of Headgear and if the mask in the picture did include ear covers then the Form Book would note the horse wore both Blinkers and a Hood. Note, the one exception being that you cannot combine Blinkers and Visors as explained in the next paragraph. The Top Right picture shows a horse wearing a Visor. On first look it would be entirely understandable if someone could not see what the difference between Blinkers and a Visor was. Looking at the full sized picture a slot cut into the centre of the Rounded plastic Cup should be visible. It is hard to know what difference this makes to what the horse can see behind and to the side of them. But, presumably it, at least, enables them to be aware of movement behind them. Since a 'Visor' is a 'pair of Blinkers' with slots cut into them then they are not used together. Note that the slots cut into the blinker cups can be any width and length. Note that this horse is also wearing a Sheepskin Noseband (aka Shadow Roll) across its nose. These do not have to be declared despite them being a 'Vision Restricting' aid. Partly to stop horses shying at things they see on the ground in front of them (the classic example being to stop them jumping shadows and hence the name used outside of Britain). They are also used at times to try to make horses who hold their heads too high, whether naturally or because of unwillingness, to lower their heads. If they have their heads too far up wearing this type of Noseband they will not be able to see where they are going. Some trainers run all their horses in these Nosebands (AM Balding, KA Ryan, etc) and mainly for visibility and aesthetic reasons. The Bottom Left picture shows a horse wearing Sheepskin Cheekpieces. As with Blinkers they are targetting at limiting the vision a horse has behind and to the side of them. The pair in the picture (one hidden on the far side of the horse's head) would be about medium size of the range in use. They can vary in size in length and how wide they are away from the horse's head. There is no limit on what colour the Cheekpieces can be and various shades of brown are in use as well as blue dyed ones. A small pair of dark brown Cheekpieces on a dark coloured horse will be difficult to see. These sort of aids, from memory, became popular in the late 1990s and the requirement to declare their use followed from there. The Bottom Right picture shows a horse wearing one type of Eyeshield. An 'Eyeshield' being a device which covers the entire eye. In the case of the picture the 'face mask' has two, raised, wire mesh half-spheres studded into them which cover both eyes. Lessening the amount of light that gets to the eyes. Again, from memory, these do not have a long history of use in Britain. When Australian bred sprinters, most notably Choisir, starting coming over to race in Britain in the early 2000s a number wore these devices (known as 'Pacifiers' in Australia). The success of Choisir encouraging a few British trainers to use them. In 2014 their use on 2yos had dwindled to just 9 runs by three different trainers (RC Guest mainly). 'Eyeshields' also include items where the eye socket is covered by an opaque device, such as a half-sphere blinker which entirely covers the eye. These types would be used on horses with one eye missing or damaged. The 'Eyeshield' being used on just the 'blind' eye for protection
Runners wear tongue ties (TT) to keep the tongue in place and to stop it moving back into the throat and interfering with the horse's breathing ("swallowing the tongue"). The tongue tie can be made out of a variety of materials with strips of ladies' tights and specially made leather straps amongst the most common types. The use of the tongue tie must be declared by the trainer before a race and a runner will not be allowed to compete if the tongue tie is not in place. For instance, there have been non runners during 2005 when the tongue tie has been dislodged and lost on the way to post. There have also been delayed starts while jockeys (with gloves) and officials try to unpick knots in ties made of tights before trying to refit them (all very scientific).
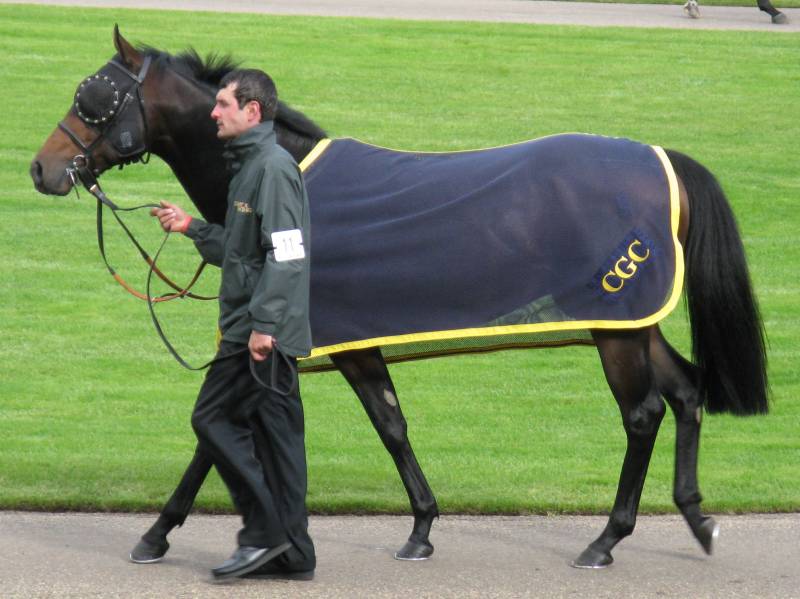
It is interesting to note how the use of Tongue Ties has decreased in recent seasons. They went through a 'fashionable' period which started around 2003 and this fad has lessened notably in 2013-14. Godolphin played a big part in the increase of use with SB Suroor fitting TTs 42 times in 2004 on 20 different horses. By 2007 he used a TT on just 2 occasions. During 2014 it appeared that trainers were back to using TTs for specific reasons on selected horses and the 'following fashion' use had gone. Only 2 trainers used TTs as many as five times with RM Beckett using a TT only on one horse. PFI Cole also had 5 runs in a TT but with 3 different 2yos. Note that the Strike Rates achieved by horses wearing Tongue Ties are generally higher than for those wearing Vision Restrictor (VR) headgear. Possibly linked to TTs being fitted to resolve a specific, physical, issue whereas a lot of VR use is on 2yos who have appeared unwilling to exert themselves fully. The fitting of headgear in those cases often seeming little more than 'hopeful' that it might produce an improvement in performance. Also note that, at times, the Strike Rate for Tongue Tie use has exceeded the overall Season average. This has occured in both 2013 & 2014, perhaps related to the use of the aid being more targetted rather than large scale use by some trainers. The picture below is of Designate who was the horse Ralph Beckett ran in a Tongue Tie 5 times in 2014, including for his win. If you look closely at the picture you can see what looks like a black plastic 'Parcel Tie' around the horse's bottom jaw, about mid-way along. The tail of the Tie hanging down below. Looking at the horse and it's tongue you might wonder whether the Tie might need loosening a notch or two. Left Click on the picture to link to the full sized version in a New Browser Tab.  4. Which courses were used most often for debut runs? The following table shows the top eight most used courses for debut runs for the seasons 2003, 2004 and 2005. Note that 'Newmarket' is the total for both the Rowley and July courses for the 2003 and 2004 seasons.
The following table shows the eight least used courses for debut runs during 2003, 2004 and 2005.
In 2006 the notes (b) & (c) proved to have predictive uses with the 16 debut runners at Chester managing a single placed run (an uncompetitive third). The only debut winner out of the four first time out runners at Epsom was Five A Side (at 10/1) for M. Johnston.
The Table below gives the 3,014 debut runs in 2007
broken down by the British racecourses and in descending order of total debut runs. Note that Newmarket has two courses which are the 'Rowley Course' used in Spring & Autumn and the 'July Course' used through the summer from early July (i.e. not just in the month of July).
5. Which trainers had above average numbers of non-runners and withdrawals during the 2004-11 seasons?
Therefore in the 2004 & 2005 seasons there were between 4.5 to 5.2% of declared horses which did not particpate for some reason. A horse classified as a non-runner (NR) was not declared as ready to run at the course on the day of the meeting. This usually means they have been diagnosed as not fit to run and will not have travelled to the course. A withdrawn (WD) horse will have made it to the course on the day and been declared ready to run. Some problem between saddling for the race and the start will then cause a withdrawal, for example, bolting on the way to post or refusing to be loaded into the stalls. The Table below summarises the trainers who had more than 50 declarations to run during the season but had percentages of non-participants above 8% compared to the overall 4.5 to 5.2% average range.
|
© British 2yo Racing. All rights reserved.