2002-2014 - Period Review
Winners
|
|
2002-2014 - Period Review Winners |
|
|
|
|
1. How many First Time Out (FTO) race winners were there in each season?
The main points to take from the table are :-
2. How does time of season affect FTO Race win percentages & overall FTO Strike Rates? On average during the whole season 17-20% of Races are won by runners making their debut. The following table and graph shows how the percentage of Races won by first time out runners varies with month during the 2yo season.
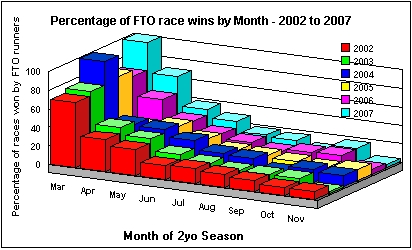 The following table lists the overall FTO Strike Rate split by month. This is the number of wins as a percentage of Runs and not of races.
Back to Top of Page 3. How does race distance affect FTO race win Percentages & overall FTO Strike Rates? On average during the whole season 15-18% of Races are won by runners making their debut. The following table and graph shows how the percentage of races won by first time out runners varies with race distance for the 2yo season.
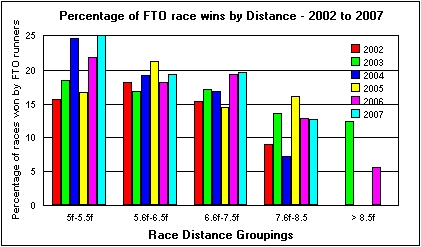 The following table lists the overall FTO Strike Rate split by Distance. This is the number of wins as a percentage of Runs and not of races.
4. What is the overall distribution of Race Wins to run number? The table below shows the number of Races in the Seasons 2005-2013 and 2014 that were won by 2yos on a particular outing.
Note two main points from the Table :-
5. What is the percentage of wins to runs for each run number? The previous section dealt with the number of Races that were won by runners on a particular outing in their 2yo career. This section covers the number of Wins by Run Number across all outings by 2yos in the Seasons 2005-2013 and 2014.
6. What is the distribution of Race Wins to run number for Maiden races?
The Tables shows the breakdown of maiden races by the Run Number that the winners were on. Note that around two thirds of Maiden races are won by runners that are on their first or second starts. Note that, despite some high looking Strike Rates in the 2005-2013 period, all Run Numbers return a solid loss to a 1 Point Level Stake wagered at SP on every runner in the Group. The Return on Investment (ROI) figures are in the Range -29% to -38% except for 7TO Runs (-18%) and 10TO+ Runs (-58%). The ROI across all Runners in Maidens during the 2005-2013 Period was -32%. Maiden races which are won by runners after a high number of previous starts are usually at lesser courses and require moderate winning performances. The three wins by runners on their tenth, or later, start in 2005 were at Catterick, Nottingham & Wolverhampton and rated only 63, 61 & 55. In 2006 the two wins were at Catterick & Bath rating 56 and 62. The three 8TO wins in 2007 were at Brighton, Wolverhampton & Yarmouth with two at higher end seller race quality ratings. In 2008 four of the 5 maiden wins at 7TO or higher were at Brighton, Catterick, Redcar & Warwick by horses who had a BHA rating of 64 or 72. The one exception was Richard Hannon's Heliodor who was rated OR78 and won at Goodwood. He made an early May debut over 5f and ran in a number of races that suggested the trainer thought he was useful. The impression in mid-season was that he had OR80+ ability but was idle and would not show it on the racecourse. He eventually won when stepped up to 9f in late season and won a Conditions race over 10f afterwards. In 2009 the six 7-8TO wins were made up of two at Bath plus one each at Catterick, Hamilton, Thirsk & Wolverhampton. 5 of the 6 were in the OR58-72 BHA rating range and classic 'Eternal Placer' quality runners in that sense. 4 of the 6 were notable as pace forcing 'short runners' who struggled to last out 5f in earlier races and found easy events to win when they had learnt to settle down a little in the initial stages of races. The one exception was Rakaan who had placed in the Coventry Stakes but then struggled to win in maiden races afterwards. He was trained by Bryan Meehan who regularly has this type of horse and watching them try to manage tidying up maiden wins from August onwards a traditional part of the season. Rakaan is an interesting horse overall and matching his physical make-up to his Run Style and then adding in the Meehan factor is very instructive in why he took 8 attempts to win. in 2012 the five 7-8TO wins were at Bath, Carlisle, Hamilton, Musselburgh & Newcastle with two MR Channon wins in the North included. 4 of the 5 were rated between OR65 to 74 before their wins with the other rated OR79 but beaten off OR77 after the maiden win. One peculiarity in that Sorella Bella went from OR72 before her 8TO Carlisle win to run in Listed & Group 1 races in Italy afterwards for Channon. She won a Listed race and placed second in a Group 1. Her OR went up to over 100 because of those runs. But, her best Timefigure was still in the low 70s. How much of the 'Italian Form' was real improvement and how much due to poor quality races? Channon has a long history of such 'improvement' in late season in weak Italian & German races which seems to have 'disappeared' again in the 3yo season back in Britain, Ireland & France.
7. What is the distribution of Race Wins to run number for Nursery Races?
Note: (a) Horses usually need at least 3 runs to gain an official BHA handicap rating to qualify for Nurseries. Note that in spite of the high Strike Rates for previous winners running in Nurseries STO or 3TO they still produce solid losses. In the 2005-2013 period the Return on Investment (ROI) for STO runners in Nurseries was -26% and -27% for 3TOs. The ROI for placing a 1 Point Level Stakes win bet on all Nursery runners in that period would have been -21%. Compare this to the -32% ROI for all runners in Maidens during the same period. There were 26 wins by 2yos on their 12th outing, or more, in the period 2005-2013 and the 'Usual Suspects' are responsible for the majority of those wins. MR Channon trained 11 of 26 and PD (David) Evans trained 6 of them. Only TD Easterby, with 2, has more than a single win otherwise. In 2014 there were 4 winners of Nurseries on 11TO or 12TO and none on later outings. No surprises with 3 of the 4 trained by Channon and the other by David Evans. In 2007 there were 14 debut winners who ran in Nurseries on their second outings with 2 winning (14.3%) at SPs of 11/2 and 3/1 (dead heat) and a solid loss to level stakes. The 9 winners on 3TO were from a group of 86 representatives with the longest SP of a winner 11/2 and with five of them at less than 5/2 and a strong loss to level staking on all qualifiers. Trainer Mick Channon has been responsible for 6 of the 19 Nursery winners on their tenth or later runs in the three seasons 2005-7, typically with a runner that won in early season. These have either been runners that improved in later season (e.g. Wovoka & Grantley Adams) or moderate types that have run often enough for their handicap mark to get back down to a competitive level for the individual. The two winners in 2004 had both run in the first 2yo race of that season at Lingfield on the polytrack on March 20th. In 2008 the 7 winners at 9TO or higher were split as two for PD (David) Evans (with Kingswinford on his 12th & 14th runs), two for Bryan Meehan and one each for Mick Channon, Jonathan Jay & Mark Johnston. In 2009 Mr Channon had four different horses that won in Nurseries on 9TO or later. Three other trainers had two successes but all were double wins by the same horse with PD Evans with Transfixed (13th & 20th runs and the busiest 2yo with 24 runs by turf season end and carried on running through the Winter on the AW), PS Mcentee (Angie's Nap, whom he had claimed during the season) & N Tinkler (Bossy Kitty on her 12-13th outings). In 2010 there was an increase in Nursery events with many in later season after divisions of AW races in Late September to November. The increase in nursery winners on 10TO+ partly caused by this but an unusual season in the number of horses that won more than one nursery. The increase in 3TO wins in nurseries over the season 2009-10 also seems to be because previous winners have got into handicaps on usable ratings. No change in that Mick Channon accounted for 5 of the 15 wins for 10TO+ runners with 4 different horses including one that won 15-16TO in handicaps. In 2012 Channon produced 6 of the 10 winners on their 10th outing or more with four different horses and two dual nursery winners. He was responsible for 4 of the 5 winners on 11TO or later including three successes on 14-15TO by the dual winners. 8. What finishing position had STO/3TO first time winners achieved in their previous run? The tables below cover all horses who had their first win on either their Second (STO) or Third run (3TO), i.e. previous winners who won again on their second and/or third run are not included.
|